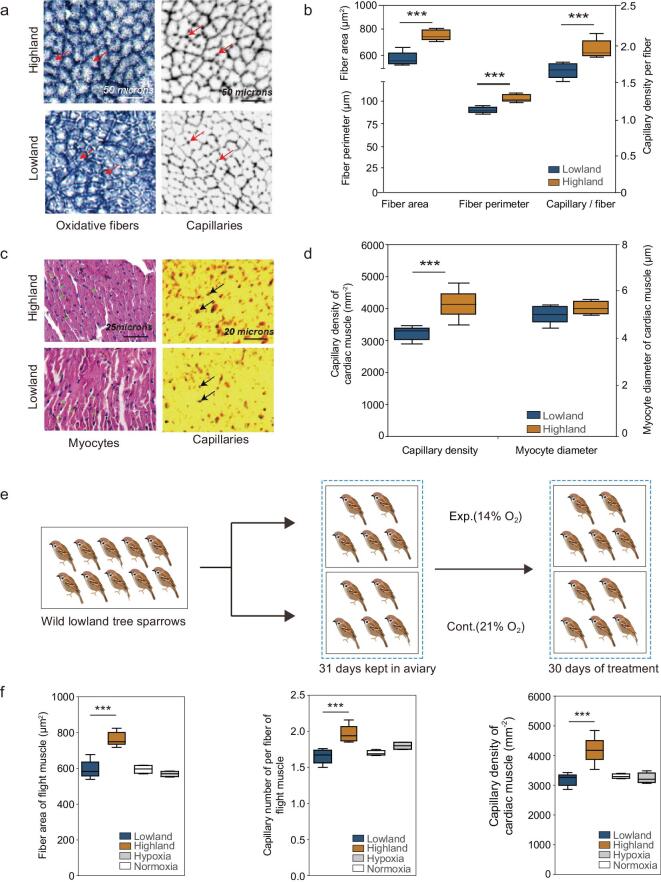
Figure 2.
Histological analyses of the flight and cardiac muscle. (a) Representative images of the fast oxidative glycolytic fibers. Red arrows show fiber sizes (left) and capillaries (left) of the lowland (upper) and highland tree sparrows (lower), respectively. (b) The flight muscle in the highland tree sparrows has a significantly larger fiber area (F1,11 = 44.7, P < 0.001), perimeter (F1,11 = 47.29, P < 0.001) and capillary number per fiber than the lowland tree sparrows (F1,11 = 21.41, P < 0.001). Mean and standard error are shown. Blue boxes, lowland tree sparrows; orange boxes, highland tree sparrows. (c) Representative images of the cardiac muscle. Blue lines show myocyte diameters (right) and black arrows show capillaries (left) of the highland (upper) and lowland tree sparrows (lower), respectively. (d) The cardiac muscle in the highland tree sparrows has only slightly larger myocyte diameters (F1,13 = 2.99, P = 0.1) but significantly larger capillary density (F1,13 = 30.84, P < 0.001) than in the lowland tree sparrows. Mean and SE are shown. (e) Acclimation experiment protocol for the hypoxia-exposed lowland tree sparrows and control lowland tree sparrows. (f) The fiber areas of the flight muscle (left), the number of capillaries per flight muscle (middle) and the capillary density of the cardiac muscle (right) in the experimental birds (grey boxes) were similar to those of the control birds (white boxes) and the wild lowland birds (blue boxes), but all were reduced when compared to those of the highland tree sparrows (orange boxes).

