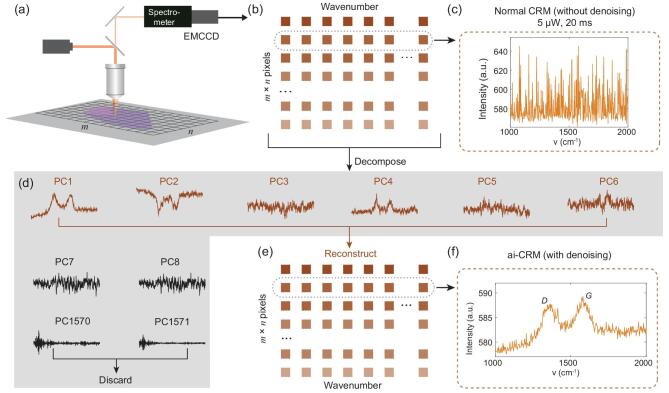
Figure 1.
Schematic illustrating the ai-CRM procedure. (a) Raw dataset containing m × n pixels is collected using an EMCCD, and (b) assembled into a matrix in which each row contains a spectrum of a pixel and each column represents a wavenumber. (c) A representative noisy spectrum from a dataset recorded on a GO sample. (d, e) The PCs from a PCA of the measured dataset. PCA effectively decomposes the dataset into a low-dimensional space (here the first six PCs) containing mostly signal and a high-dimensional space (PCs seven to end) that contains mostly noise. PCs carrying signal information are used to reconstruct the dataset (e), whereas the rest of the PCs are set to ‘zero’ in the reconstruction. (f) Reconstructed spectrum of the same pixel as in (c) with dramatically improved SNR clearly showing the D and G bands of GO.

