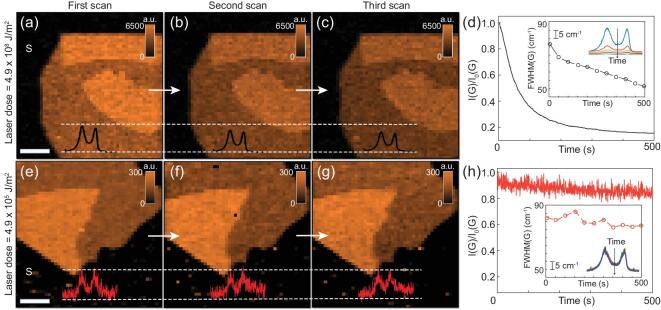
Figure 3.
Reliable Raman mapping of GO at minimum laser power with ai-CRM. (a–c) Raman maps of GO (A(G)) done at the same location, one after the other using a CCD, with a laser power of 4 mW. (e–g) Raman images of GO done using ai-CRM, at 1000x reduced laser power (4 μW) showing minor loss of contrast and integrated intensity. (d, h) Variation of the normalized intensity of the G peak of GO, obtained from single-pixel time series data for 4 mW (d) and for 4 μW (h). The insets show the variation of the spectra as well as the FWHM of the G peak. All data recorded at 50 ms integration time per pixel. All scale bars correspond to 5 μm and all Raman maps have a resolution of 50 × 50 pixels.

