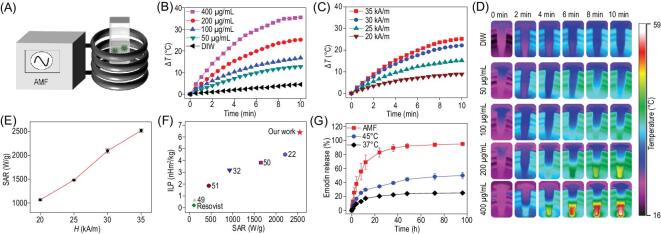
Figure 2.
(A) Schematic illustration of the magnetic hyperthermia test. Time-dependent temperature change curves with (B) different EMM concentrations and (C) different AMF intensities. (D) Thermal images of (B). (E) The SAR values of EMMs at different AMF intensities. (F) The ILP and SAR values comparison of EMMs and other iron oxide nanomaterials. (G) The release curves of emodin from EMM dispersions after the treatment for 10 min at 37°C and 45°C, and in response to the stimuli under AMF.

