Figure 3.
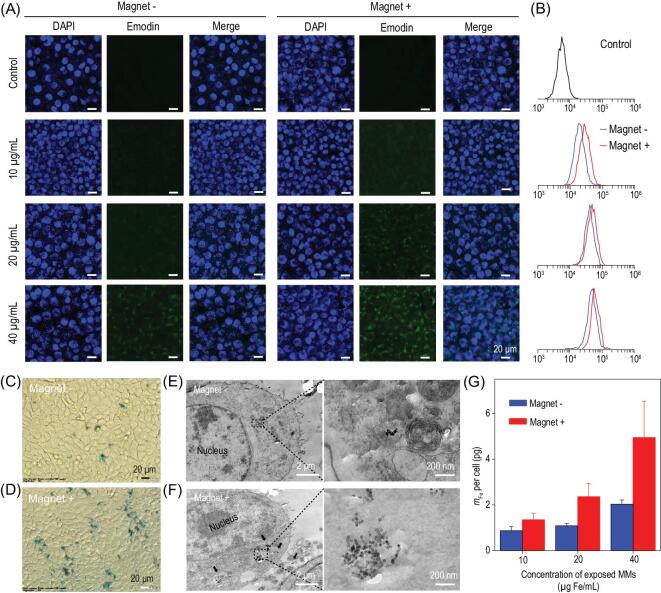
Cellular uptake of EMMs under magnetic targeting. (A) Confocal laser scanning microscopy images and (B) corresponding flow cytometry results of 4T1 cells exposed to EMMs at varying concentrations in the presence or absence of an external magnet. All scale bars are 20 μm. (C, D) Iron staining images and (E, F) cellular TEM images of 4T1 cells co-cultured with 40 μg/mL MMs. (G) The iron mass per cell measured by ICP-AES analysis after the exposure to MMs.

