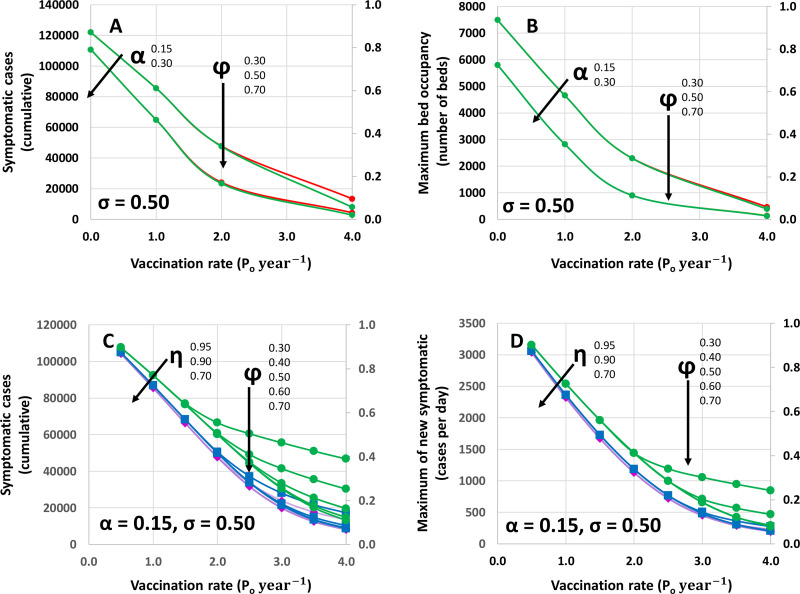
Fig 4. Effect of different values of vaccination coverage and vaccination rates on pandemic indicators.
(A) Number of cumulative cases, and (B) maximum bed occupancy predicted in response to the application of different vaccination rates whereby the entire population could be vaccinated within a year (vaccination at γ = Po year-1), within six months (vaccination at γ = 2 Po year-1), or within three months (vaccination at γ = 4 Po year-1) at different values of vaccine coverage: 30% Po (ϕ = 0.30: red), 50% Po (ϕ = 0.50: yellow), and 70% Po (ϕ = 0.30: green). Curves for two different values of the coefficient of testing effort are presented (α = 0.15 and α = 0.30). The secondary axis indicates fractional values with respect to the same reference (i.e., no vaccination, moderate social distancing (σ = 0. 50), and basal testing effort (α = 0. 15). (C) Number of cumulative cases, and (D) maximum number of new symptomatic cases per day predicted in response to the application of different vaccination rates (γ = 0.5 Po to 4.0 year-1) and at different values of vaccine coverage (from 30% to 70%; ϕ = 0.30 to 0.70). Curves for three different values of vaccination efficacies are presented (η = 0.95; magenta rhombs, η = 0.90; blue squares, and η = 0.70; green circles). The secondary axis indicates fractional values with respect to the same reference (i.e., no vaccination, moderate social distancing (σ = 0. 50), and moderate testing effort (α = 0. 30).

