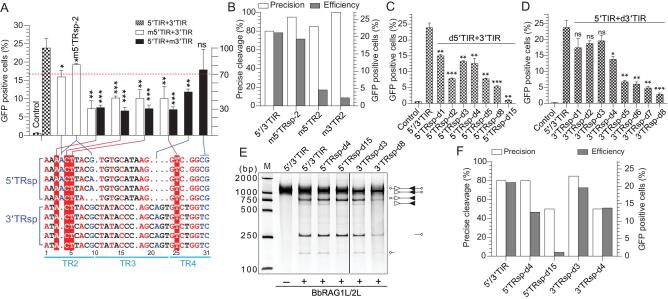
Figure 4.
Recombination and cleavage assays revealed the importance of the length and sequence of TRsp for the activity of ProtoRAG. (A) Quantification of GFP-positive cells produced by BbRAG1L/2L-mediated recombination with the TRsp-altered substrates. (Below) Alignment of the TRsp sequences from several 5′/3′TIRs of ProtoRAG in B. belcheri. The conserved nucleotides are colored red and some of them were singly mutated in 5′TIR and 3′TIR (shaded with red). Several non-conserved nucleotides are colored blue and were mutated in 5′TIR or 3′TIR. The regions and the sequence numbers of 3′TIRs are shown as indicated. Recombination corresponding to the mutated substrate in 5′TIR and 3′TIR is shown by the linked lines above the alignment. (Top) The left and right y-axes are the same as those in Fig. 1F. (B) Statistics of precise cleavage and the average recombination efficiency produced by recombination with several TRsp-mutated substrates. The left y-axis shows the percentage of precise cleavage and the right y-axis shows the percentage of GFP-positive cells. The deletion of fewer than 10 bases in the HDJ sequence with complete transposon sequence removal was considered a product of precise cleavage. (C) Quantification of GFP-positive cells produced by BbRAG1L/2L-mediated recombination with partial deletion of the 5′TRsp substrates. All deletions in the substrates began from the 3′-end of 5′TRsp that adjoined 5′TR5 and the length of the deleted nucleotide is shown in the substrate name. The 3′TIR was untouched in these deletions. -d: deletion. (D) Quantification of GFP-positive cells produced by BbRAG1L/2L-mediated recombination with the partial deletion of the 3′TRsp substrates. All deletions in substrates began from the 3′-end of 3′TRsp that adjoined 3′TR5 and the length of deleted nucleotide is shown in the substrate name. The 5′TIR was untouched in these deletions. -d: deletion. (E) Cleavage of the partially deleted TRsp substrates by purified BbRAG1L/2L proteins; the composition of the cleavage product is shown on the right according to the length of the corresponding fragments. Unfilled and filled triangles indicate the 5′TIR and 3′TIR sequences of ProtoRAG, respectively. (F) Statistics of precise cleavage and the recombination efficiency produced by recombination with the partially deleted TRsp substrates. The left y-axis shows the percentage of precise cleavage and the right y-axis shows the percentage of GFP-positive cells. The deletion of fewer than 10 bases in the HDJ sequence with complete transposon sequence removal was considered a product of precise cleavage. GFP-positive cells are expressed as the mean (+/– SEM) and significant differences were analysed with a two-tailed Student's t-test after comparing the number of GFP-positive cells with those in 5′/3′TIR. The significance levels are indicated according to the p-values: *: p < 0.05, **: p < 0.01, ***: p < 0.001.

