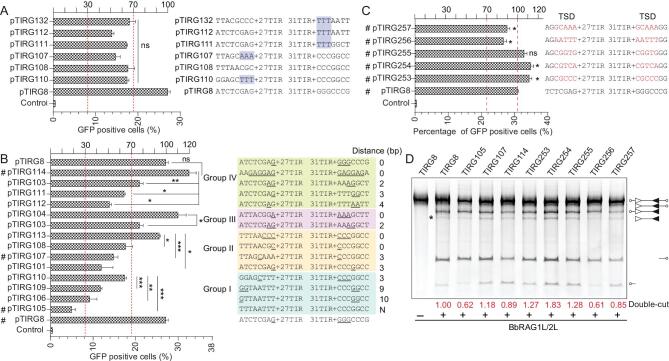
Figure 5.
CG-rich microhomology in the flanking sequences is important for the activity of ProtoRAG, as revealed by the recombination and cleavage assays. (A) Quantification of GFP-positive cells produced by BbRAG1L/2L-mediated recombination with the TIR substrates containing the altered flanking sequences. AAA and TTT are shaded in blue. Significant differences in GFP-positive cells among the altered substrates were analysed with one-way ANOVA. (B) Quantification of GFP-positive cells produced by BbRAG1L/2L-mediated recombination with TIR substrates containing a homologous flanking sequence. The TIR substrates were divided into four groups according to their flanking sequences; the potential microhomology sequences are underlined and the distance between two microhomology sequences is shown on the right. (C) Quantification of GFP-positive cells produced by BbRAG1L/2L-mediated recombination with TSD sequences containing TIR substrates. TSDs are listed and marked in red. (D) Cleavage of flanking sequence-altered TIR substrates with purified BbRAG1L/2L proteins; the composition of the cleavage product is shown on the right according to the length of the corresponding fragments. Unfilled and filled triangles indicate the 5′TIR and 3′TIR sequences of ProtoRAG, respectively. The double-cut products (marked with *) were quantified with ImageJ using the product of pTIRG8 as a reference. GFP-positive cells are expressed as the mean (+/– SEM) and significant differences were analysed with a two-tailed Student's t-test; the significance levels were indicated according to the p-values: *: p < 0.05, **: p < 0.01, ***: p < 0.001.

