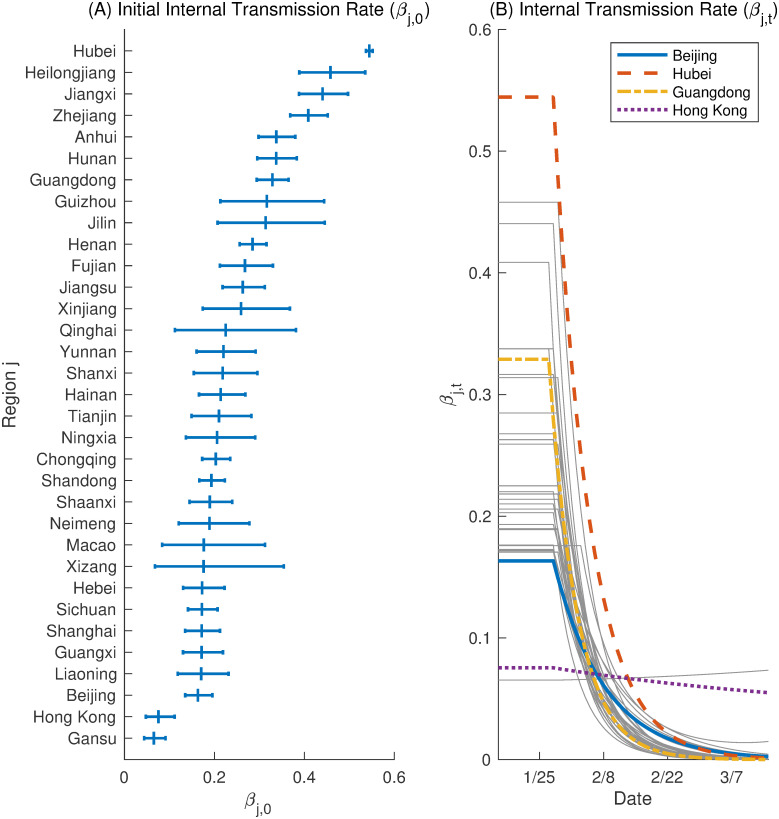
Fig 2. Internal transmission rate.
Panel (A) shows that the posterior mean of the basic reproduction number for each region with the line segment representing the 95% posterior credible interval. Panel (B) reports the posterior mean of the effective reproduction number (Rt) across regions over time.

