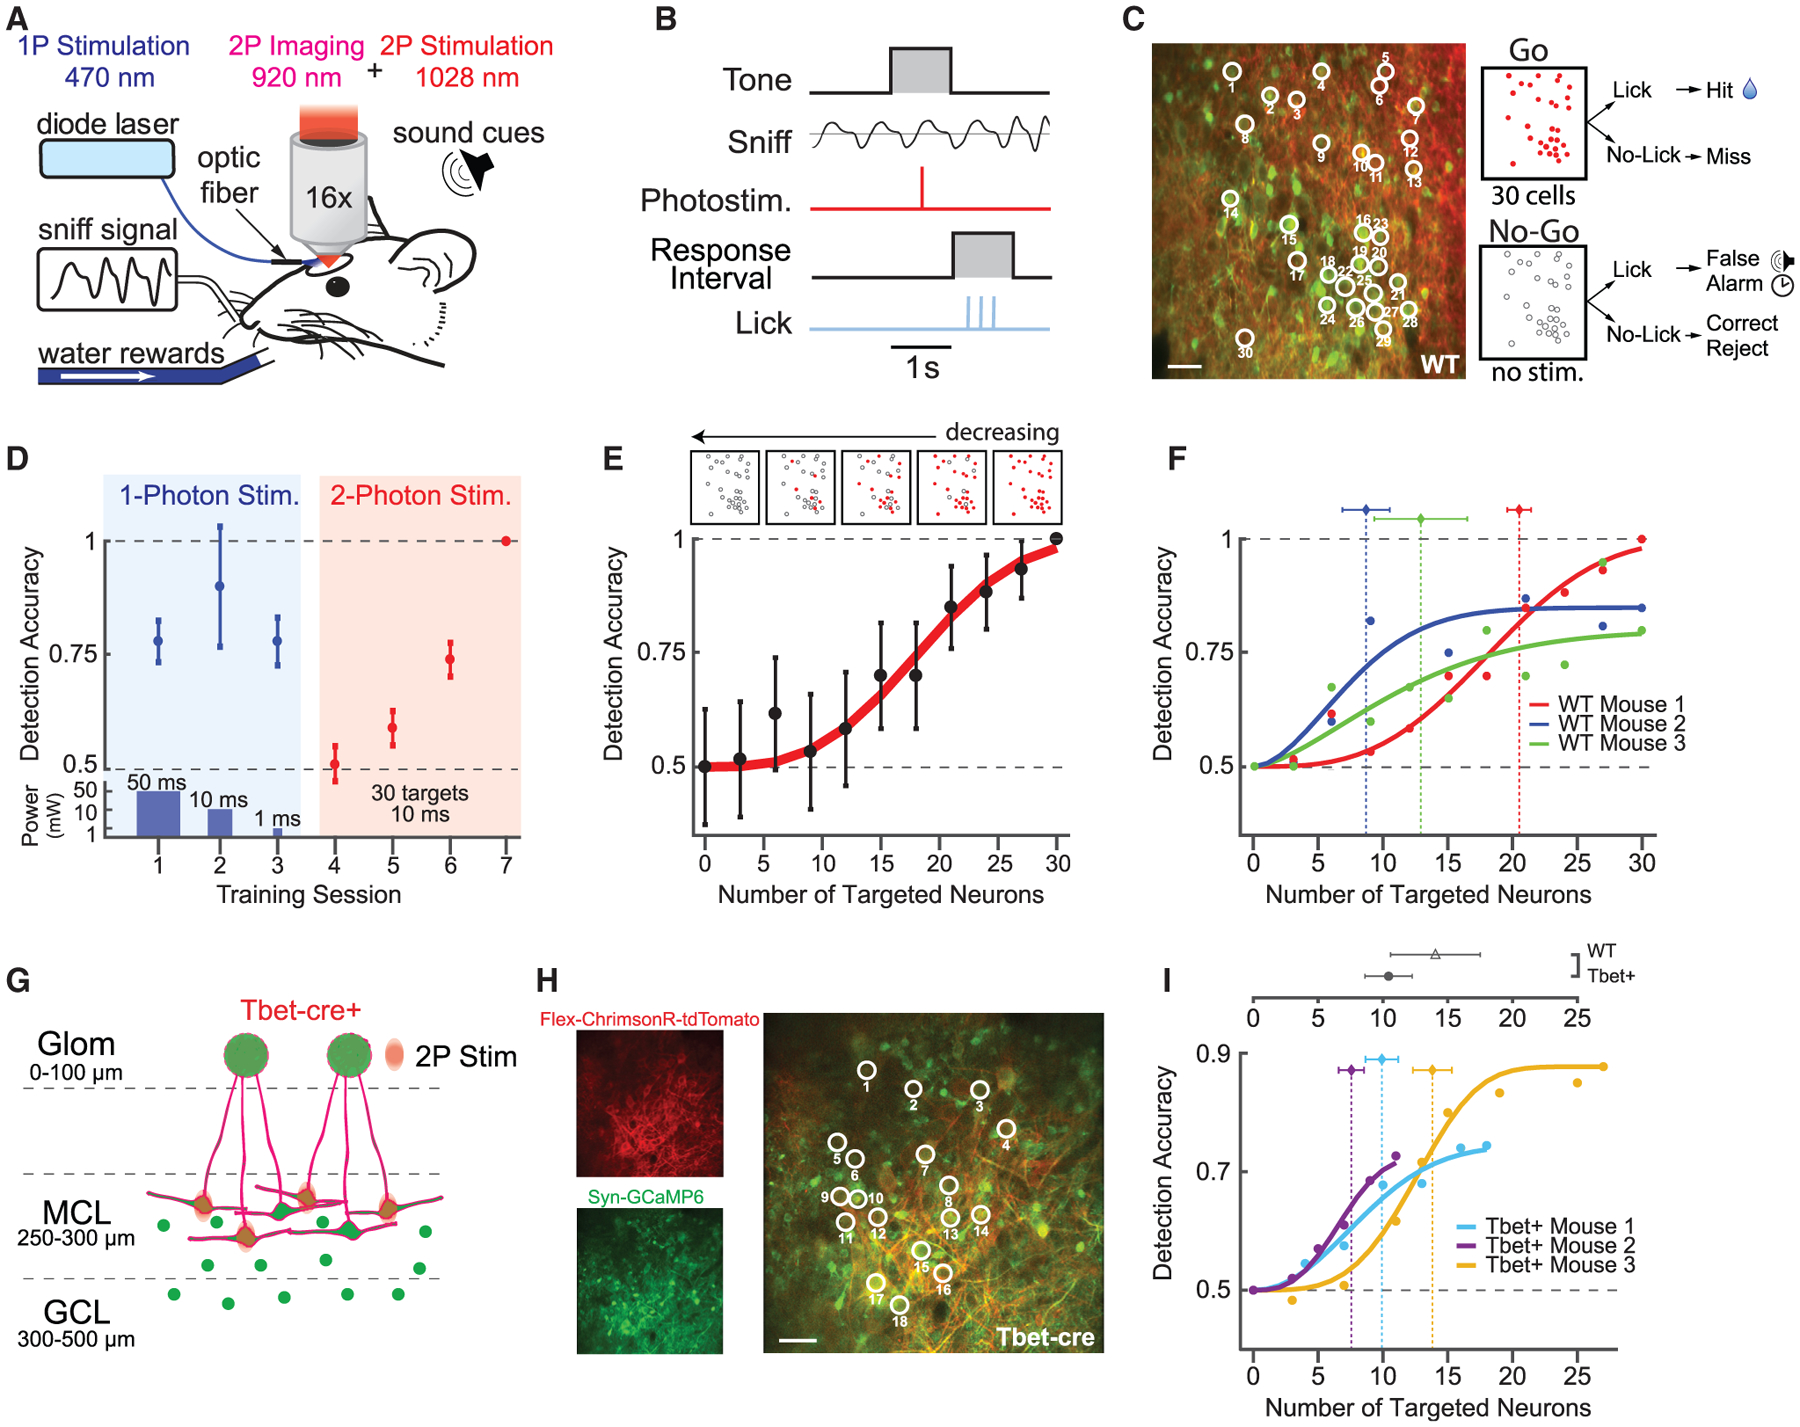
Figure 2. Behavioral Detection of Cellular-Level Photostimulation.

(A) Schematic of photostimulation detection experiment. A head-fixed mouse with a chronically implanted window above the olfactory bulb is positioned in front of a lickspout and pressure sensor to monitor respiration (sniff). Neurons were stimulated with either 1-photon blue light (473 nm) generated by a diode laser or the 2P holographic system.
(B) Trial structure for detection experiment.
(C) Left: neurons in the mitral cell layer (MCs and GCs) co-expressing ChrimsonR-tdTomato (red) and GCaMP6s (green). Thirty neurons were targeted for simultaneous photostimulation (white circles). Scale bar, 40 μm. Right: outcomes for responses to the “go” and “no-go” trials are shown. Red circles indicate stimulation of a particular cell, and empty circles indicate no stimulation.
(D) Representative session-by-session detection accuracy for 1P photostimulation (blue background) with decreasing power and duration of the stimulation (bottom panel), followed by 2P photostimulation of the same 30 targeted cells (pink background; mean ± 95% confidence intervals; n = 1 mouse; 18 mW/patch; 0.1 mW/μm2 intensity). See also Figure S7.
(E) Bottom: example detection accuracy for 2P photostimulation as a function of the number of targeted neurons, fit with a psychometric function (mean ± 95% confidence intervals; 60 trials per data point; n = 1 mouse; 0.1 mW/μm2 intensity). Top: schematic of target stimuli used in the experiment.
(F) Detection accuracy and threshold estimates across WT mice (30–60 trials/data point; n = 3 WT mice; vertical dotted lines are Weibull threshold parameter fits ± bootstrapped 95% confidence intervals).
(G) Schematic of 2P photostimulation and ChrimsonR-tdTomato expression targeted to MCs in Tbet-Cre mice. Large neurons, mitral cells; circles, granule cells; green, GCaMP6s; red, ChrimsonR-tdTomato.
(H) Left: single-channel-average images demonstrating ChrimsonR-tdTomato expression limited to a subset of MCs and GCaMP6s expression across a broad population of MCL (MCs and GCs) neurons. Right: nineteen MCs were targeted for 2P photostimulation (white circles). Scale bar, 40 μm.
(I) Detection accuracy and threshold estimates across Tbet-cre mice (60–180 trials/data point; n = 3 Tbet-cre mice; vertical dotted lines are Weibull threshold parameter fits ± bootstrapped 95% confidence intervals). Top: comparison of mean threshold in WT and Tbet-cre mice is shown (mean ± SEM; p = 0.4; two-sample t test).
