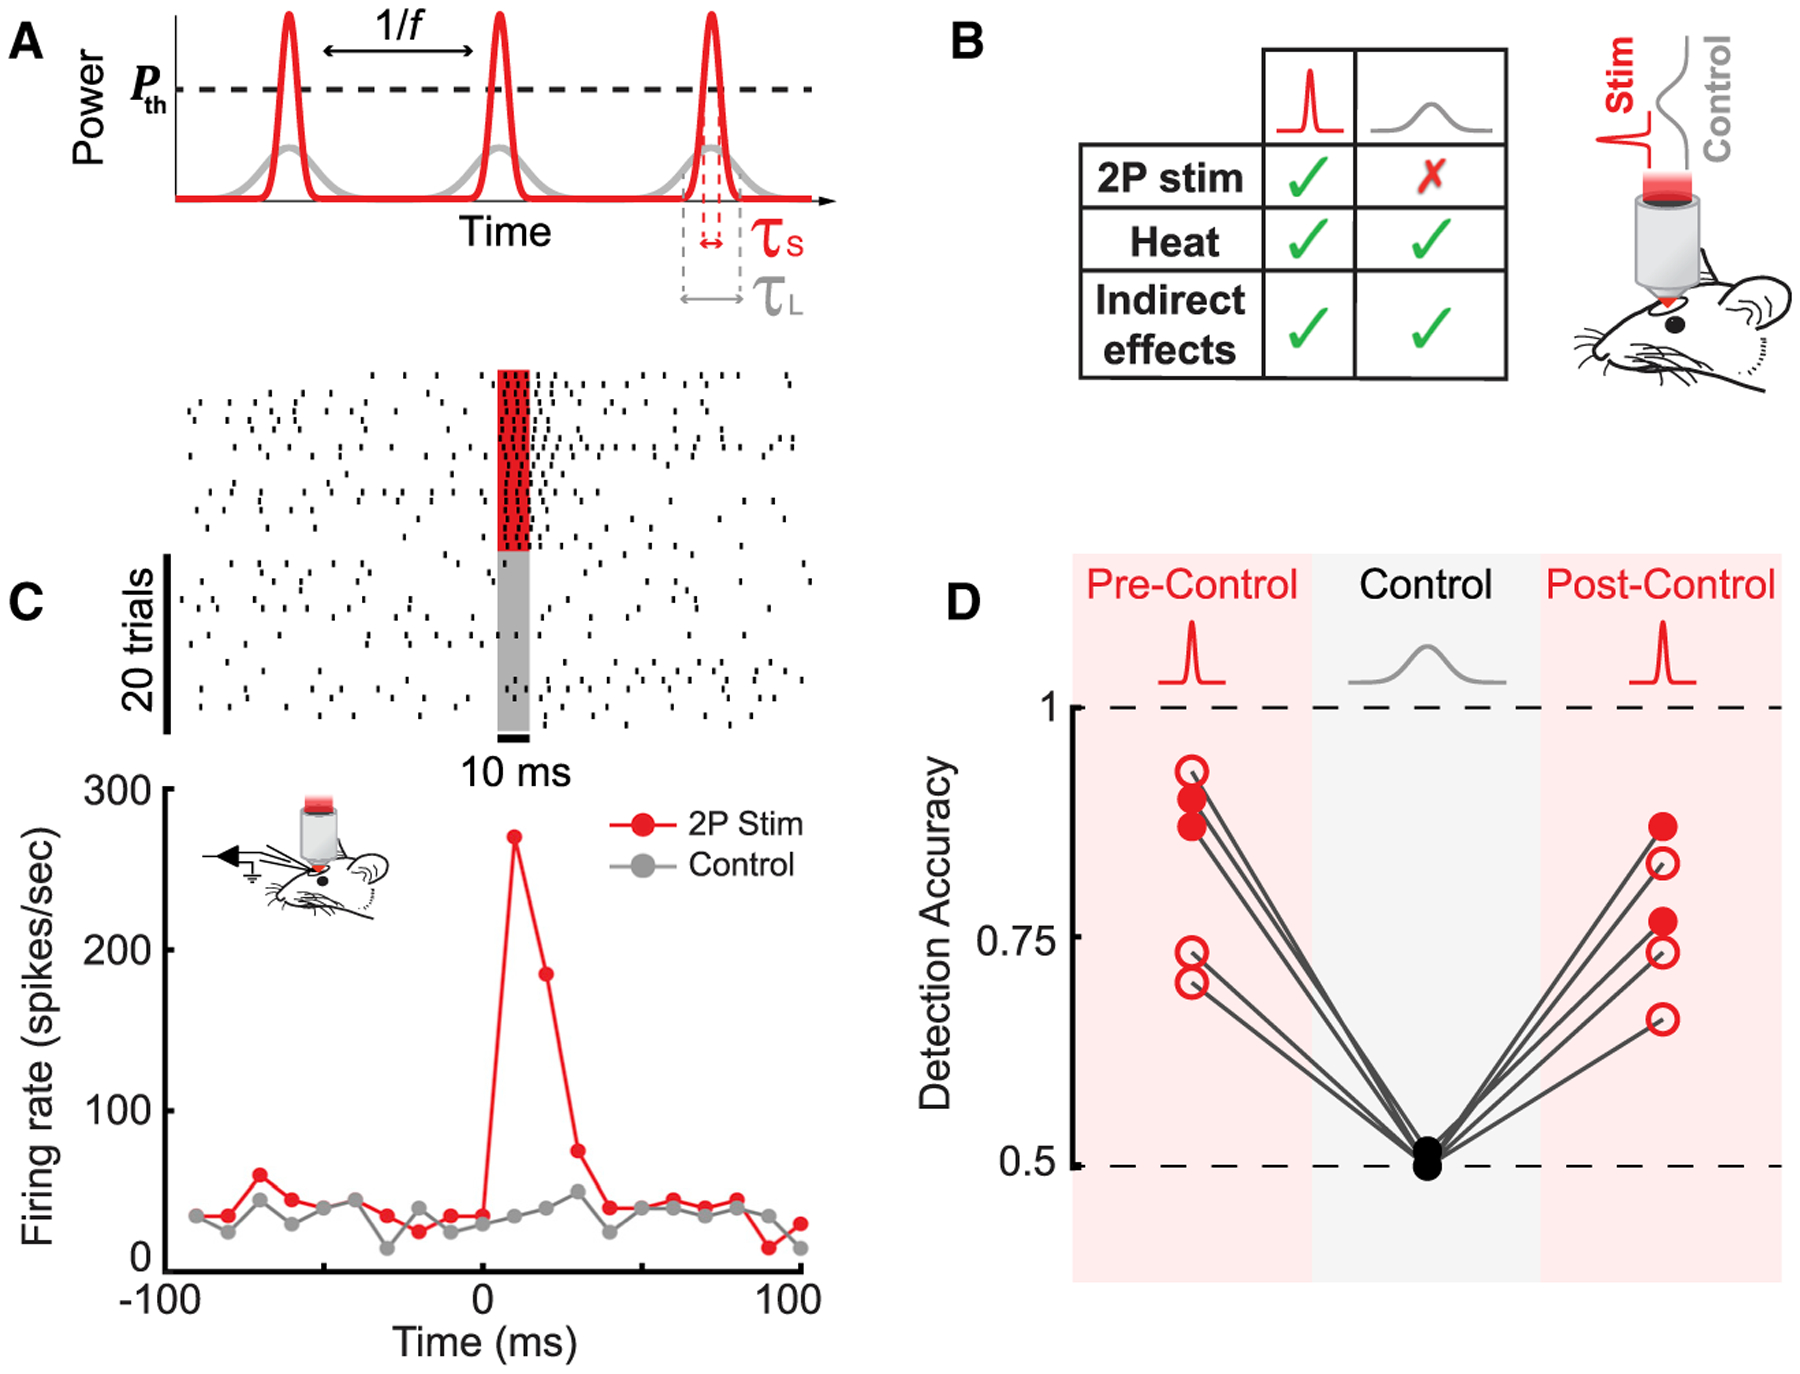
Figure 3. Testing Necessity of Spiking for Detection Using a Pulse-Duration-Based Control.

(A) A schematic demonstrating the effect of tuning the laser pulse duration. Time dependence of laser power for pulse trains with the same pulse frequency (f) and average power but different pulse durations: short pulse, τS (red) and long pulse, τL (gray). To photostimulate a cell, laser power must exceed a certain threshold, Pth.
(B) Left: a table summarizing the differences in effects evoked by the short- and long-pulse-duration stimuli. Right: a schematic of the behavioral setup for the sham photostimulation control experiment is shown.
(C) Representative example raster plots (top) and peristimulus time histograms (PSTHs) (bottom) for short-pulse photostimulation (~200 fs, red) and long-pulse sham photostimulation (control; ≥15 ps, gray; 20 trials per condition; 30 mW; 10 ms illumination; n = 1 cell in 1 WT mouse). Additional analyses are presented in Figure S9.
(D) Detection accuracy as a function of photostimulation condition. During the sham photostimulation control blocks, detection accuracy dropped to chance level (0.5 ± 0.003; mean ± SEM; p = 0.37; one-sample t test; 0.06–0.125 mW/μm2; n = 5 mice, 2 WT [filled circles] and 3 Tbet-cre [empty circles]) and was significantly different from both pre- and post-control measurements (p < 0.001; Fisher’s exact test; 0.06–0.125 mW/μm2; n = 5 mice; 2 WT [filled circles] and 3 Tbet-cre [empty circles]).
