
Figure 4. Specificity of Photostimulation-Evoked Activity.
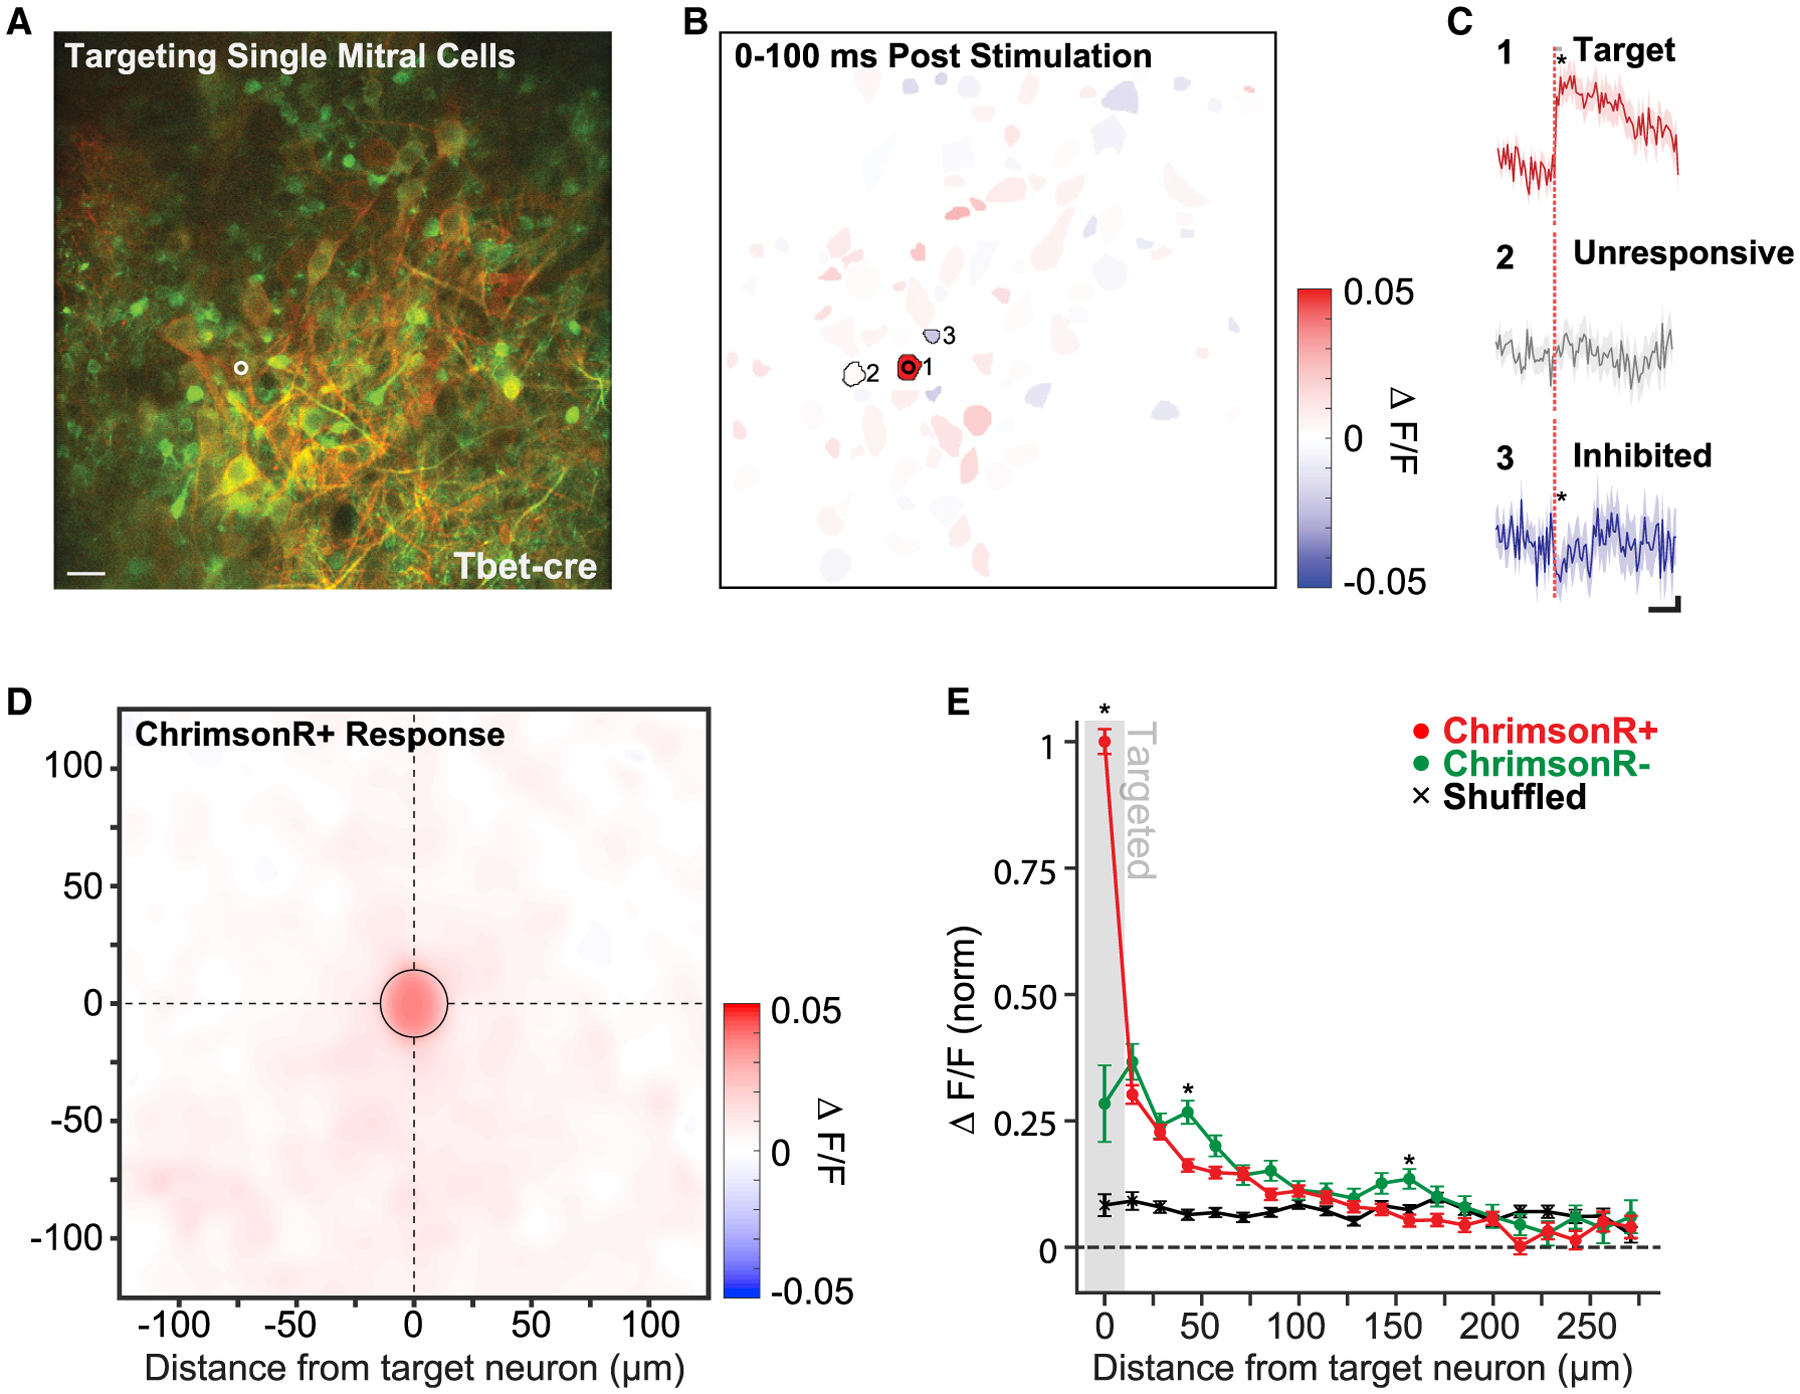
(A) Example FOV centered on the mitral cell layer of a Tbet-cre mouse. One mitral cell is targeted for 2P photostimulation (white circle, 15 μm diameter). Red labeling corresponds to FLEX-ChrimsonR-tdTomato expression limited to a subset of mitral cells, and green labeling corresponds to pan-neuronal GCaMP6s expression. Scale bar, 40 μm.
(B) Segmented regions of interest (ROIs) from the same FOV as (A) colored by mean evoked response to photostimulation (3 pulses: 10 ms on–10 ms off at 30 mW or 0.19 mW/μm2; 60 photostimulations) of the targeted mitral cell (cell 1).
(C) The response to photostimulation of 3 example cells: cell 1, the target neuron; cell 2, neighboring unresponsive neuron; and cell 3, neighboring inhibited neuron (solid lines and shading are mean ± SEM; 60 photostimulations; *p < 0.05; two-sample t test). Significance of modulation following photostimulation was computed by comparing mean activity in a 100-ms window following the offset of photostimulation (gray bar) to mean activity in a 100-ms window prior. Scale bar values are 500 ms horizontal and 0.01 df/f vertical.
(D) A spatial heatmap of average response versus ROI position centered on 49 MC targets (n = 2 Tbet-cre mice, 138 total neurons, 3,631 photostimulations). Only cells labeled with ChrimsonR-tdTomato were included. The “targeted” bin is outlined by a black circle.
(E) The average radial decay of responses across ChrimsonR-tdTomato-positive neurons (red) and ChrimsonR-tdTomato-negative neurons (green). Cell responses were averaged within 14 μm (20 pixel) bins radiating out from each targeted neuron, and bin means were averaged across targets (mean ± SEM; 49 targeted neurons; n = 2 Tbet-cre mice). Shuffled data correspond to the average binned responses of the same neurons with stimulation times randomly chosen (see STAR Methods). Asterisks indicate a significant difference between the average binned response of ChrimsonR+ and ChrimsonR− neurons (*p < 0.05; two sample t test; Holm-Bonferroni corrected for multiple comparisons).