Figure 1.
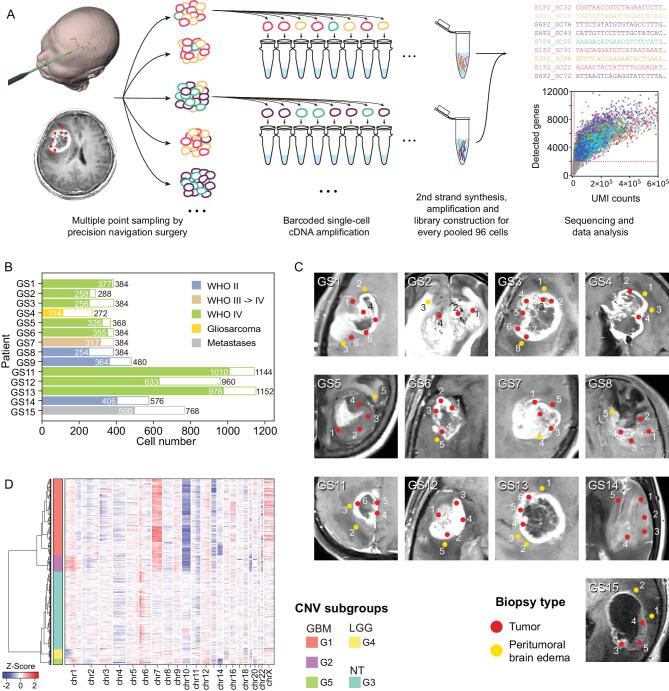
General information on experimental procedure and generated data. (A) Experimental procedure. Multiple point sampling was done by precision navigation surgery, followed by single-cell isolation and barcoded single-cell cDNA amplification. After every 96 cells were pooled together, the sequencing library was constructed by several experimental procedures. (B) Pathology information and cell number of 14 patients collected in this study. White bars and colored bars represent raw cell number and filtered cell number in each patient, respectively. (C) Medical imaging and biopsy locations of all sampling points in each patient. Red and yellow dots mark locations of tumoral and peritumoral sampling points in the MRI image. (D) RNA-derived single-cell CNV information. Hierarchical clustering divided all glioma-related cells into five CNV subtypes.

