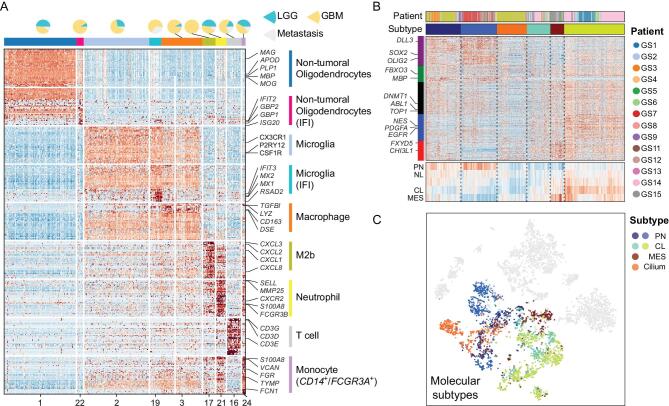
Figure 3.
Cell type annotation of tumor microenvironment cells and malignant cells. (A) Heatmap shows marker genes of sub-clusters of tumor microenvironment cells. Pie plot at the top shows cell ratio of LGG/GBM/metastasis samples. Cells in clusters marked with IFI show interferon-induced property. (B) Cells clustered by TCGA 4 classification genes. Heatmap at the bottom shows the average expression value of five gene-sets marked in the left color bar. (C) Tumor cell subtype mapped in t-SNE coordinates.

