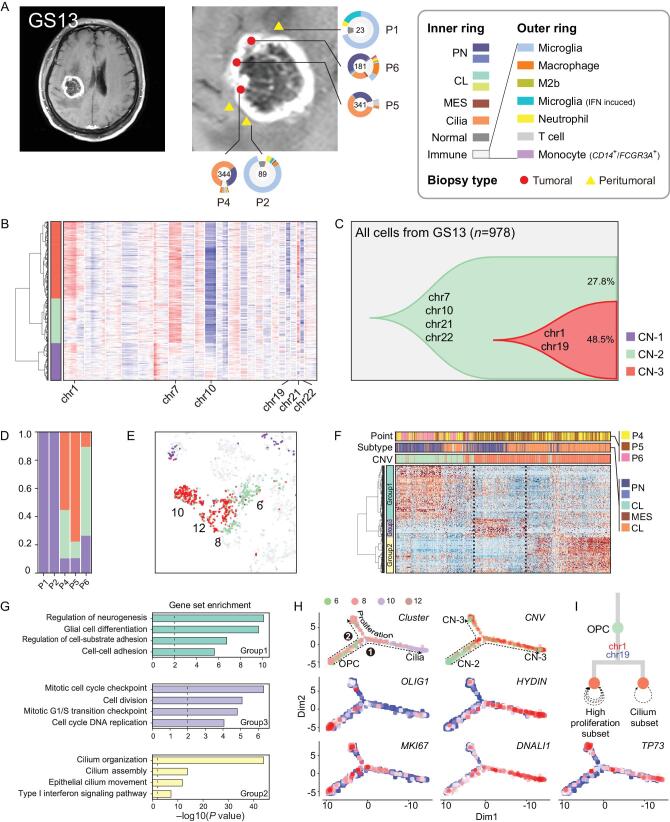
Figure 5.
Glioma clonal evolution of Patient GS13 at spatial and temporal resolution. (A) MRI image of Patient GS13. Yellow and red markers in zoomed image represent peritumoral and tumoral sampling points. Ring plot in the right and bottom displays cell components of each point. Color of the inner ring shows classified glial cell subtypes, and the outer ring shows detailed immune cell subtypes. Cell numbers are labeled in the center of these ring plots. (B) Single-cell CNV heatmap, cells are divided into three groups by hierarchical clustering. (C) Clonal evolution trail followed by accumulating CNV events. Each color represents a CNV subclone and chromosomes are labeled in which copy number alterations occurred during clonal transition. (D) CNV subclone components in each sampling point, P6 had a lower CN-3 ratio than P4/5. (E) CNV subclone distribution in t-SNE coordinates. When CN-2 developed into CN-3, cells translocated from cluster 6 to cluster 12/10. (F) Heatmap of differentially expressed genes between CN-2/5 glial cells. Hierarchical clustering was applied in both gene and cell dimensions. Differential genes could be divided into three gene-sets, marked with the left color bar. (G) Functional enrichment of three gene-sets in (F). (H) Single-cell trajectories of malignant cells in GS13. Top left subplot colored by global t-SNE clusters, two branches of cells were developed from OPC cells. The top right subplot is colored by CNV group. The remaining four subplots were relative expression patterns of marker genes (OLIG2, HYDIN, MKI67, DNALI1 and TP73). (I) Branched clonal developing model of GS13.

