Figure 6.
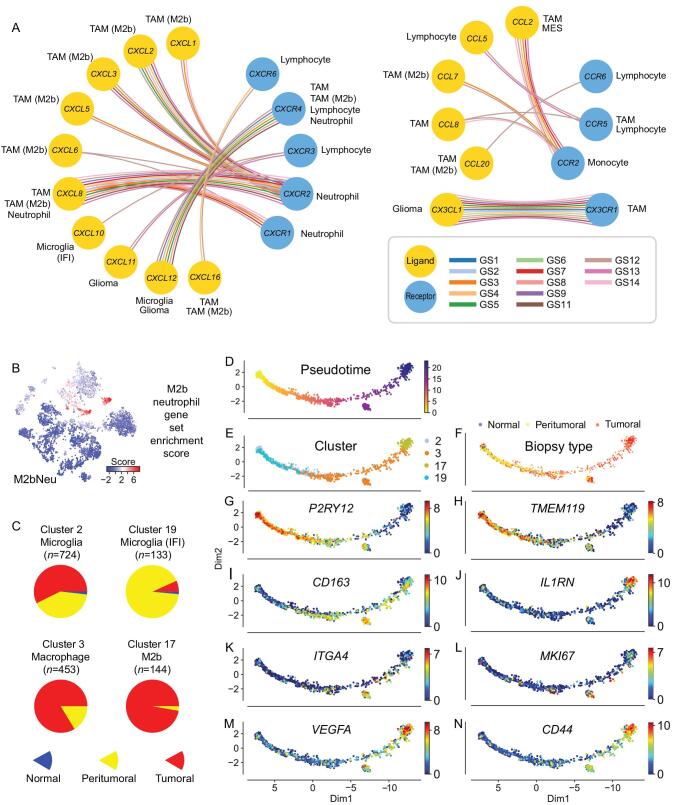
Characteristics of M2b macrophages and neutrophils and their potential in prognosis prediction using M2bNeu score. (A) Major chemokine and chemokine receptors relationship inside glioma tissue. (B) Dot plots show the M2bNeu score distribution in the optimized global t-SNE map. These scores were calculated by M2bNeu genes listed in Supplementary Fig. 14C. (C) Biopsy type distribution of tumor associated microglia and macrophage cells. (D) Trajectory analysis of macrophage/microglia evolution on TAM cells from all patients, colored by (D) pseudotime, (E) optimized global t-SNE clusters, (F) biopsy types and (G–N) marker genes expressed in the pseudotime trajectory map.

