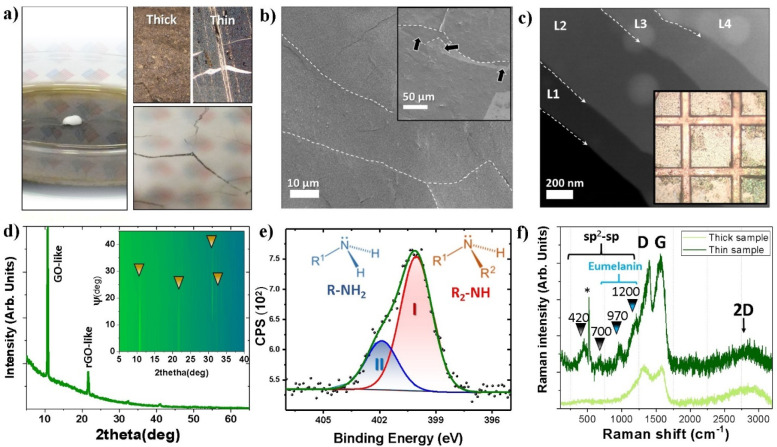
Figure 1.
(a) (left) Image of the synthesis dish used for the PDA polymerization; (bottom right) image of the reflective surface of the Petri dish with a membrane connecting and breaking after the scooping by silicon. (top right) Optical image of the scooped and thick layers of PDA on polished silicon. (b) SEM images of the surface of thin PDA samples at different magnifications. Dashed lines show grain boundaries and black arrows the layered structure. (c) STEM micrographs of transferred sample on TEM grids. L1 to L4 show the increment of layers found in the samples; dashed lines show the borders. Inset shows an image of the grid under a microscope (grid size 204 μm). (d) XRD diffractogram for thick PDA sample. Inset shows the Ψ vs 2Θ–ω scan with yellow arrows pointing to diffraction peaks. (e) Shows two main nitrogen (N 1s) species observed in the thin sample by XPS. (f) Raman spectra for both thin and thick samples marking the D, G, and 2D distinctive peaks. Additionally, the black arrows show the additional vibration observed for the thin sample. (∗) points to the silicon substrate vibration. The cyan region shows the vibration that resembles those reported for eumelanin.

