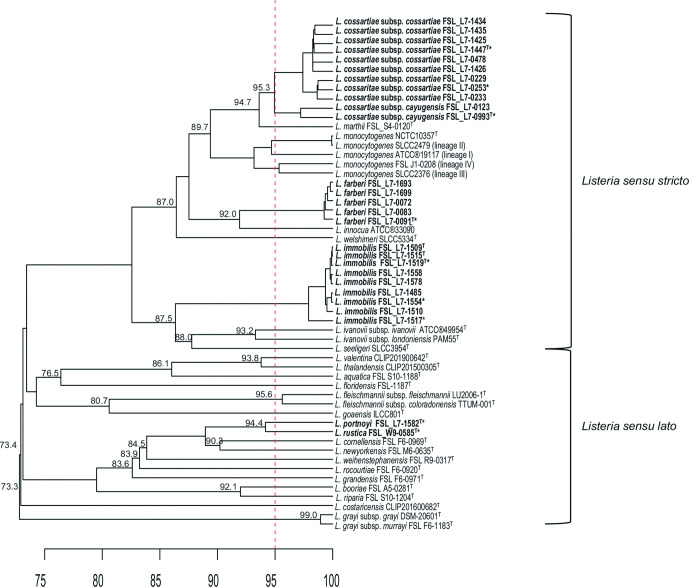
Fig. 1.
UPGMA hierarchical cluster dendrogram based on the average nucleotide identity blast (ANIb) analysis of all 27 draft genomes representing the five novel Listeria species and two subspecies proposed here and 28 reference strains representing 21 Listeria species. The vertical bar is placed at 95 corresponding to the proposed 95 % ANIb cut-off for species differentiation [75]. The horizontal scale represents ANI percent similarity. The values placed on nodes represent ANI similarities; for terminal nodes, this value represents the similarity between the two taxa; for internal nodes, the value represents the similarity between the two taxa in the different branches that are most similar to each other. ANI similarities are only shown for nodes that split a given species from one or more other species. The isolates selected for phenotypic characterization are indicated with an ‘*”. The novel species are bolded with type strains identified by a superscript T.

