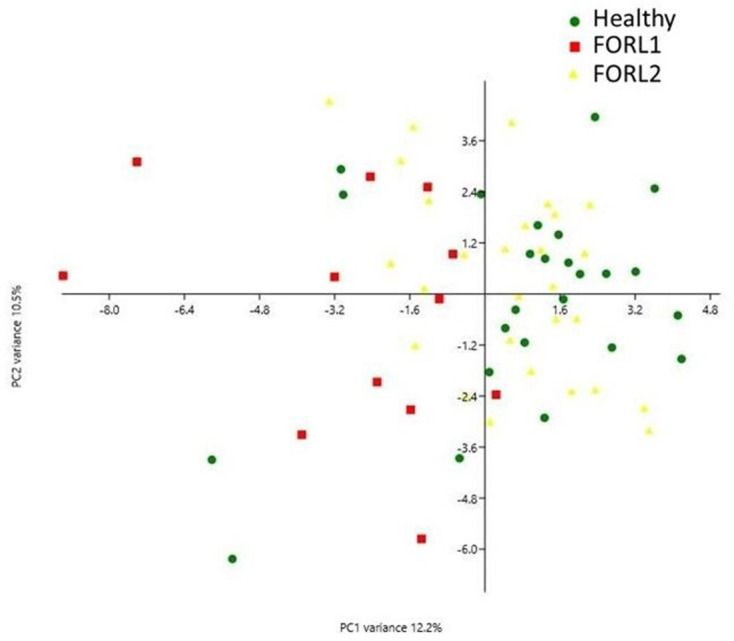
Fig. 5.

PCA plot of sub-groups identified following two-step cluster analysis. Green dots represent the microbiomes of feline oral health (n=25), red squares represent the microbiomes of the FORL-1 sub-group (n=12) and yellow triangles represent the microbiomes of the FORL-2 sub-group (n=28). Following two-step cluster analysis, the oral health group and FORL-2 sub-group clustered together (but were distinct from the FORL-1 sub-group), indicating similarity in their microbiome composition.
