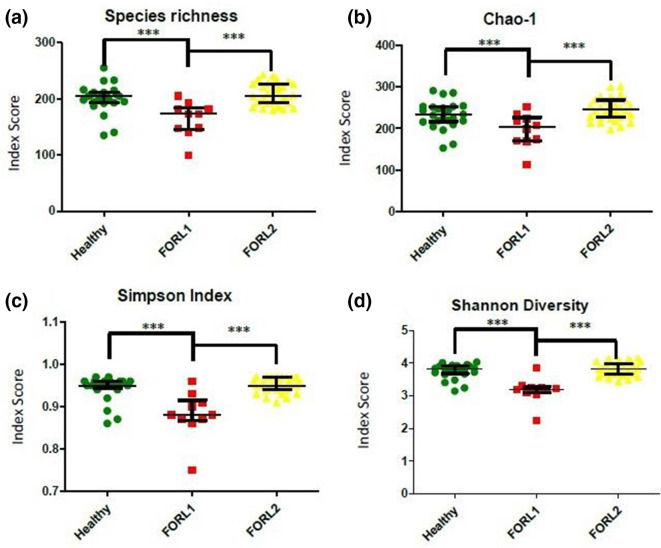
Fig. 6.
Diversity analysis of microbiomes in feline oral health and FORL following two-step cluster analysis. (a) Observed species richness (number of OTUs per sample). (b) Chao-1 index. (c) Shannon diversity index. (d) Simpson index. Samples from feline oral health (n=25) are shown in green, those from FORL-1 sub-group (n=12) are shown in red and those from FORL-2 sub-group (n=28) are shown in yellow. Following two-step cluster analysis, statistically significant differences in species richness and diversity were observed between all three groups ***P <0.001.

