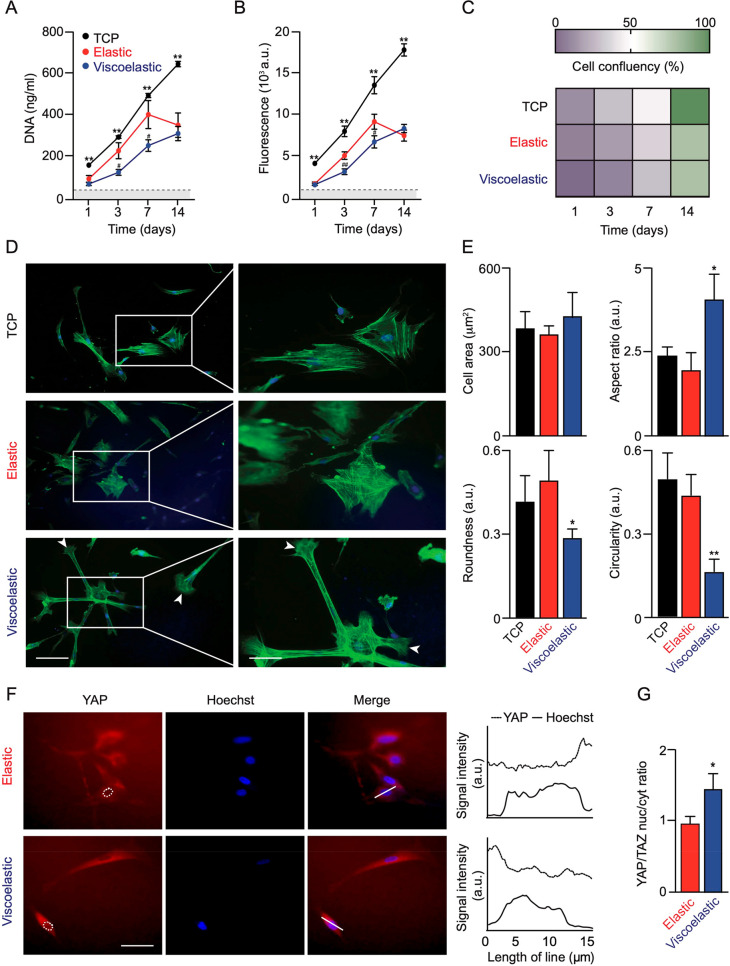
Figure 2.
Impact of substrate mechanics on MSC proliferation and morphology. (A) MSC proliferation, (B) metabolic activity, and (C) confluency at day 14. Data were analyzed from four MSC donors and presented as mean ± SD, n = 4 independent experiments. Error bars are hidden in the plot symbols when not visible; *p ≤ 0.05 and **p ≤ 0.01 comparison of silk hydrogels with tissue culture plastic (TCP) control. For #p ≤ 0.05 and ##p ≤ 0.01 comparison of elastic and viscoelastic silk hydrogel cultures at the respective time point. (D) Representative images of cytoskeletal F-actin staining and (E) quantification of morphological characteristics of MSCs (92 cells in n = 21 images from three pooled experiments). For *p ≤ 0.05 and **p ≤ 0.01 comparison of silk hydrogels with control cultures. Scale bar 20 μm. (F) Representative images of YAP staining and (G) quantification of the nuclear-to-cytoplasmic ratio of YAP (50 MSCs in n = 18 images from three pooled experiments). For *p ≤ 0.05 comparison of elastic and viscoelastic silk hydrogel cultures. Scale bar, 20 μm. Dashed white lines represent nuclear outlines. The 15 μm line in the merged images were used for the profile plots to highlight nuclear localized YAP/TAZ.

