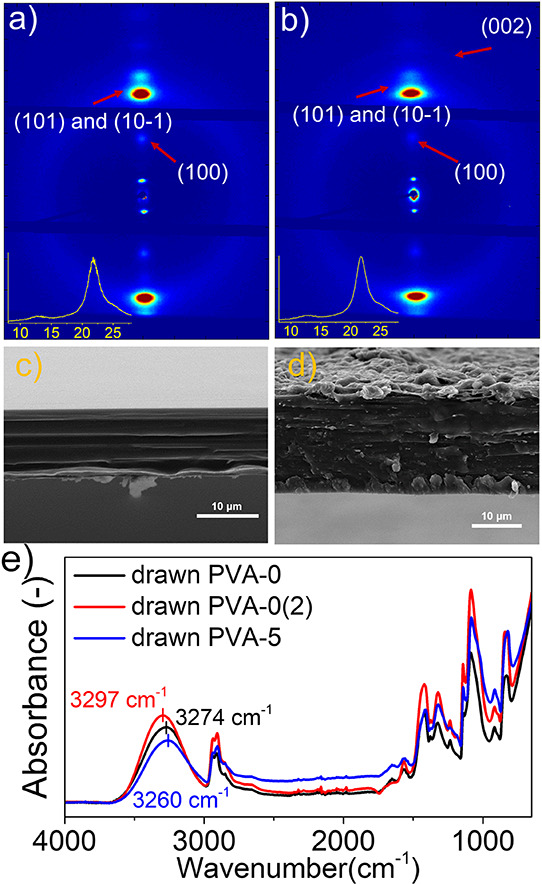
Figure 3.

WAXS patterns of drawn PVA-0 (a) and drawn PVA-5 (b) composite films. The insets are the 1D curves of X-ray scattering. Here, the plane of measured films is perpendicular to the incident X-ray (Figure S5). SEM images of the cross section of drawn PVA-0 (c) and drawn PVA-5 (d) composite films. (e) Non-polarized FTIR spectra of drawn PVA-0, PVA-0(2), and PVA-5.
