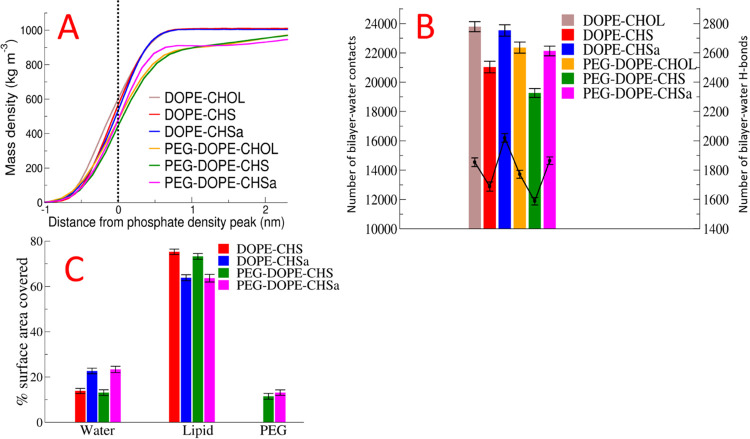
Figure 3.
Partial mass density profiles of water relative to the position of the phosphate head group peak (A). Number of bilayer–water contacts (shown in bar graphs with values on the left-hand side Y-axis) and number of bilayer–water H-bonds (in line graphs with values on the right-hand side Y-axis) (B). Percentage of area of the steroid head groups covered by other components of the system (C).

