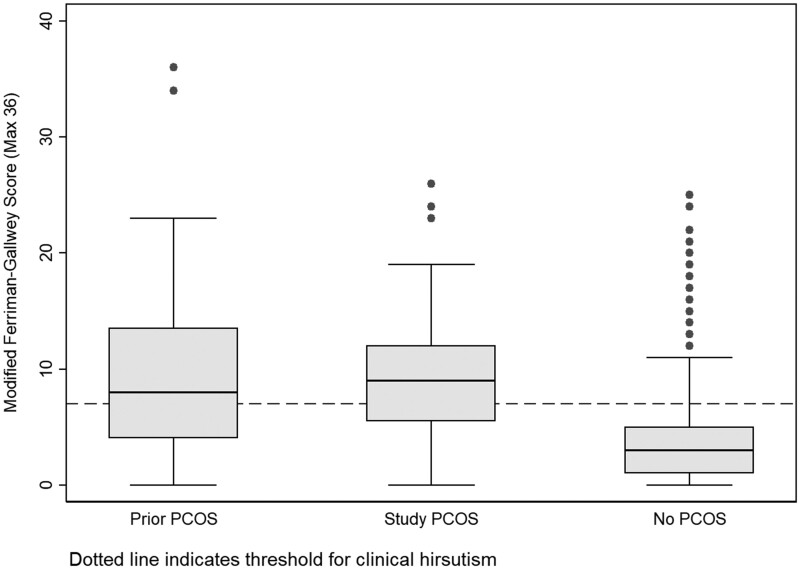
Figure 2.
Distribution of the modified Ferriman-Gallwey Score by polycystic ovary syndrome (PCOS) diagnosis group. Dotted line indicates threshold for clinical hirsutism. Upper and lower bounds of the boxes represent the upper (75%) and lower (25%) quartiles. Median values are indicated by the horizontal bar across the boxes. Whiskers indicate the spread of the data, and are calculated as 1.5 × interquartile range above the upper quartile (upper whisker) and below the lower quartile (lower whisker). Points above the box and whisker plots indicate outliers.

