
Figure 1.
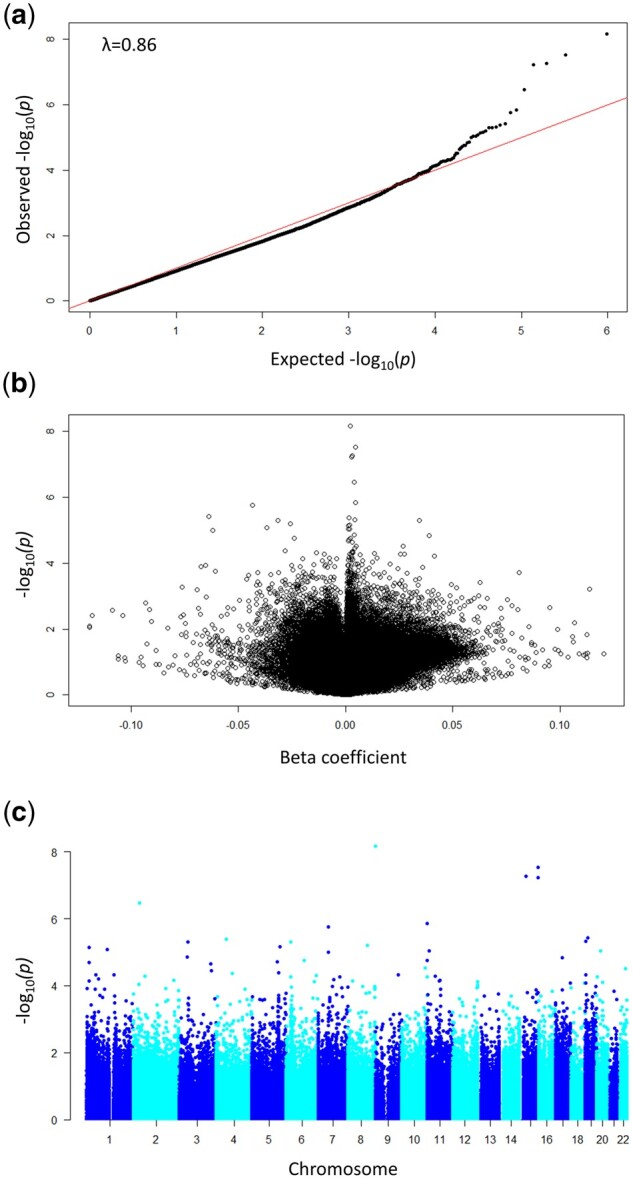
Association between cord blood DNA methylation and medically assisted reproduction estimated by the meta-analysis. (a) Quantile–quantile plot of the observed versus expected distribution of P-values; (b) volcano plot of the P-values versus the beta coefficients. λ= genomic inflation factor calculated using the median method. (c) Manhattan plot of the distribution of P-values across chromosomes.