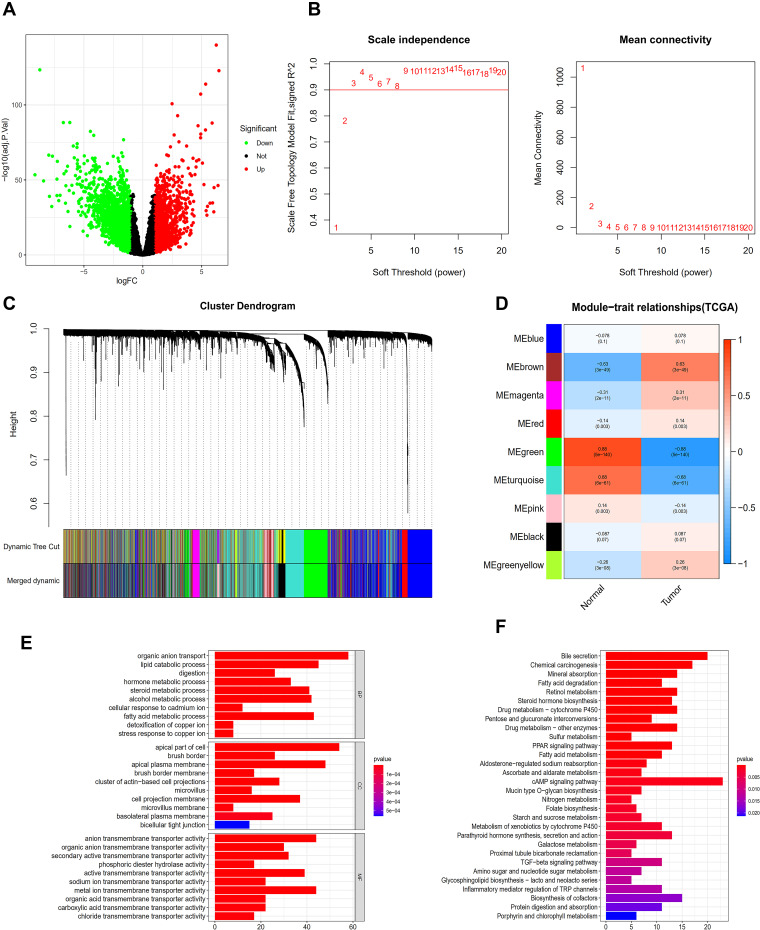
Figure 1.
Analysis of TCGA database. (A) The database erases the volcanic map of the genes that differ from the normal sample. (B) Determination of soft threshold (β) for weighted gene co-expression network analysis. (C) Gene cluster dendrogram. (D) Heat map of correlation between clinical features and module features. (E) Go histogram of co-expression differential genes. (F) KEGG histogram of co-expression differential genes.

