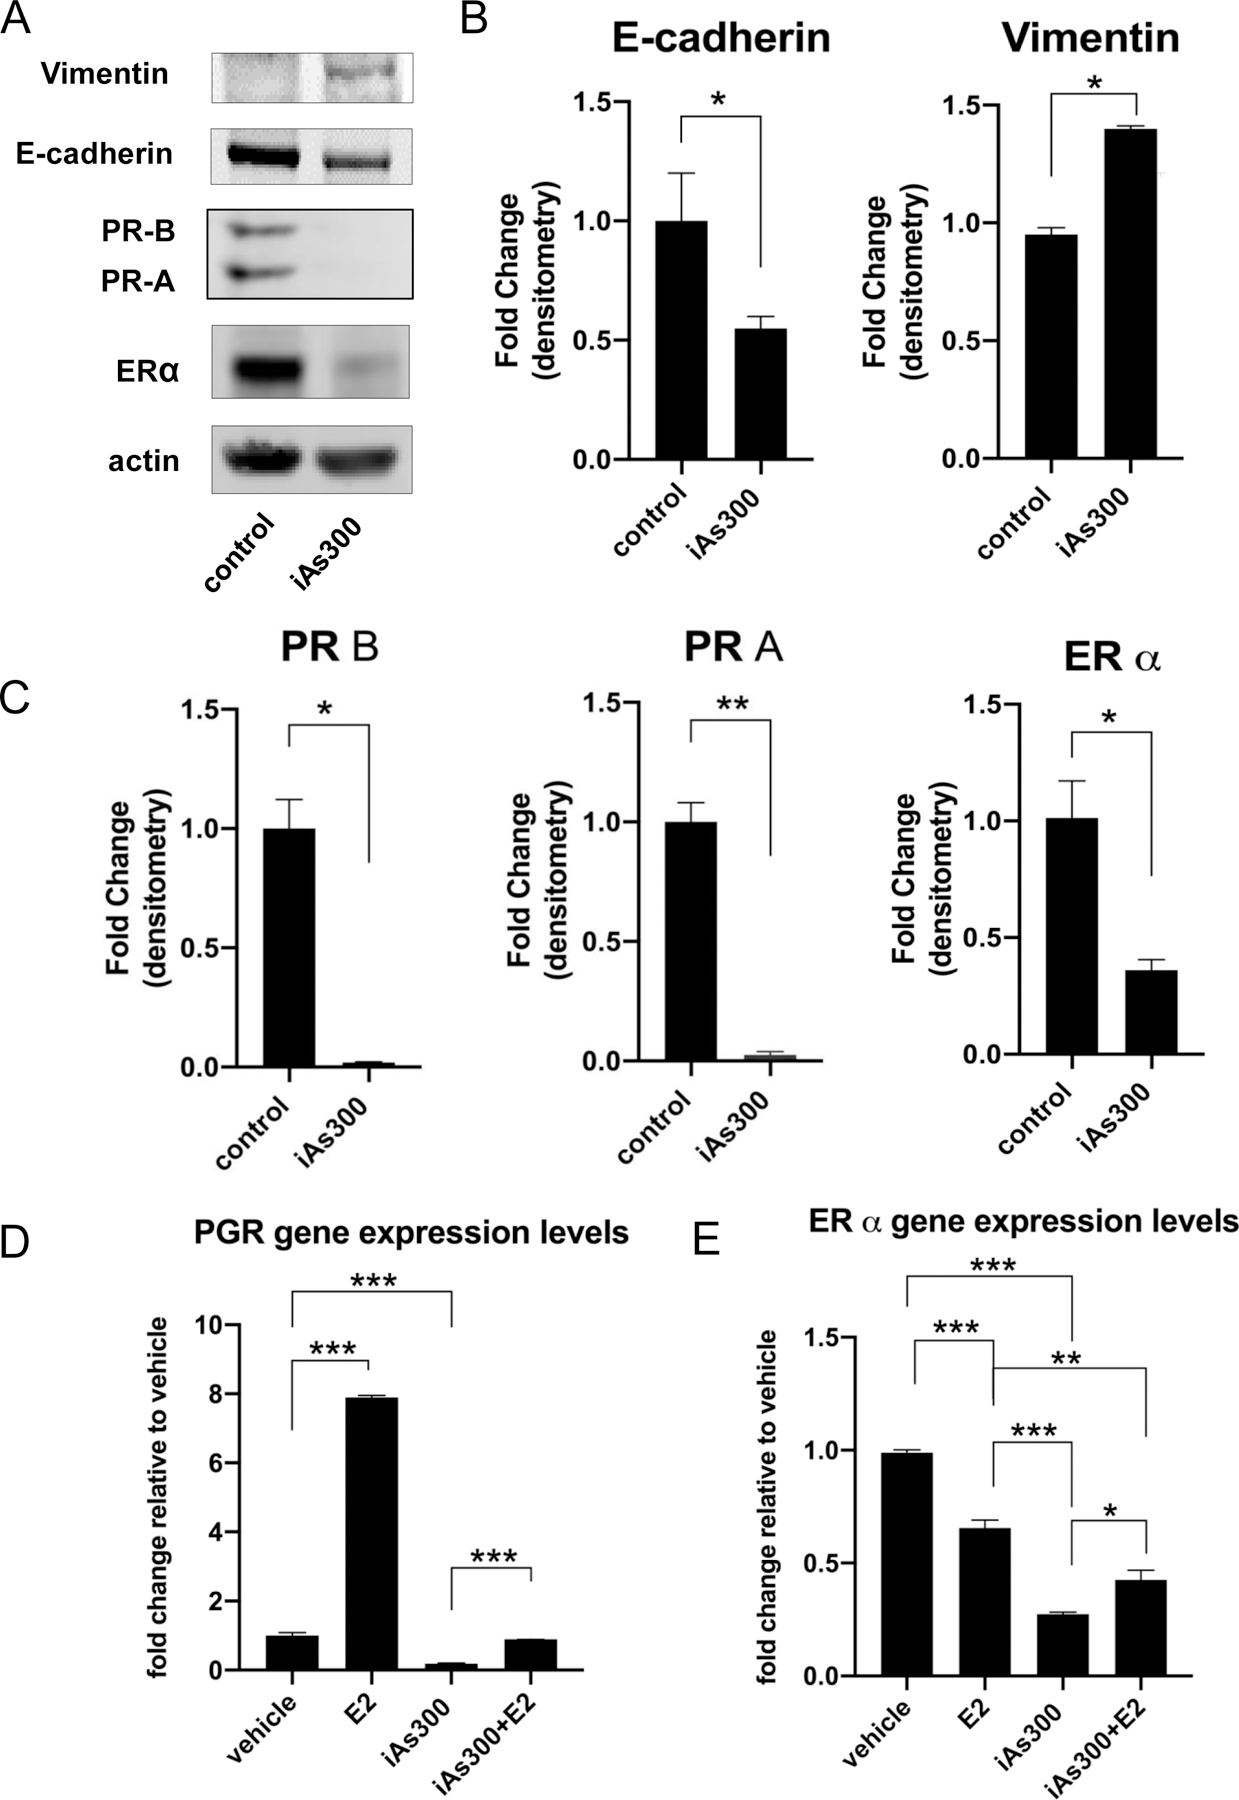
Figure 2. Molecular markers and hormone receptor status/function of MCF-7 cells treated with iAs.

(A) Western blot analysis of epithelial (E-cadherin, CDH1) and mesenchymal (Vimentin) markers as well as hormone receptor status of parental MCF-7 compared to those treated with iAs for 300 days. (B) Quantification of band intensities from E-cadherin and vimentin blots using Image J densitometry (C) Quantification of band intensities from hormone receptor blots using Image J densitometry. (D) RT-QPCR analysis of ER and PR gene expression levels in MCF-7, MCF-7-iAs300 and MCF-7-iAs300 cultured in the absence of iAs for 16 days at baseline and in response to E2. (E) Functional analysis of ER signaling at baseline and in response to E2 using select ER target genes. RT-QPCR was used to quantify ER-target gene expression with data shown as fold-change relative to untreated controls. Quantified data represent averages of at least three independent biological replicates ±SEM. *p < 0.05, **p < 0.01, ***p<0.001.
