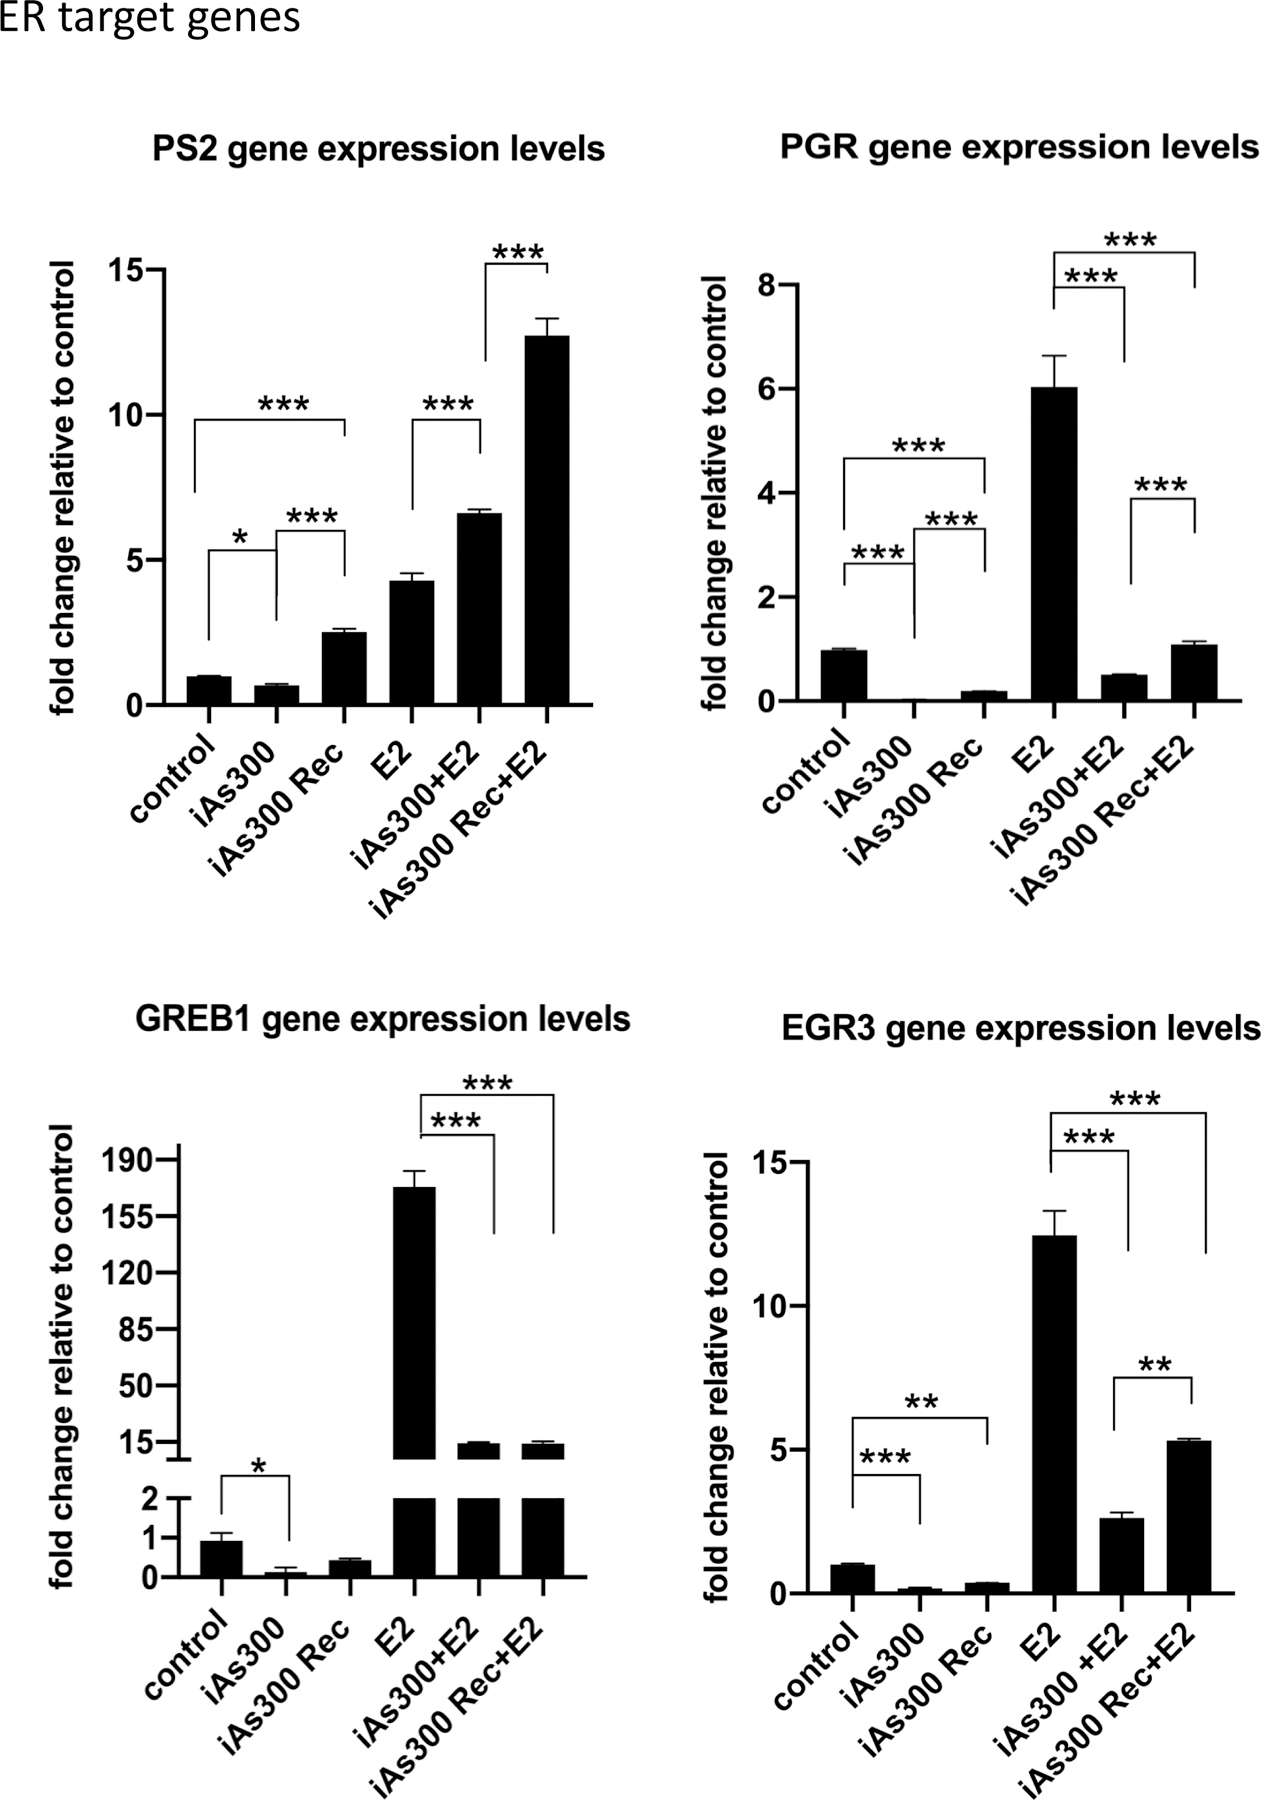
Figure 5. Functional analysis of ER activity assessed by examining target gene expression by RT-QPCR.

(A-D) RT-QPCR analysis of selected ER-target gene expression in MCF-7 cells as well as MCF-7 exposed to iAs (100 nM) for 300 days prior and after a 16 days recovery period. Analysis were performed at baseline and after stimulation with E2. Results are presented as averages of at least three independent biological replicates ± SEM. *p < 0.05; **p < 0.01; ***p < 0.001.
