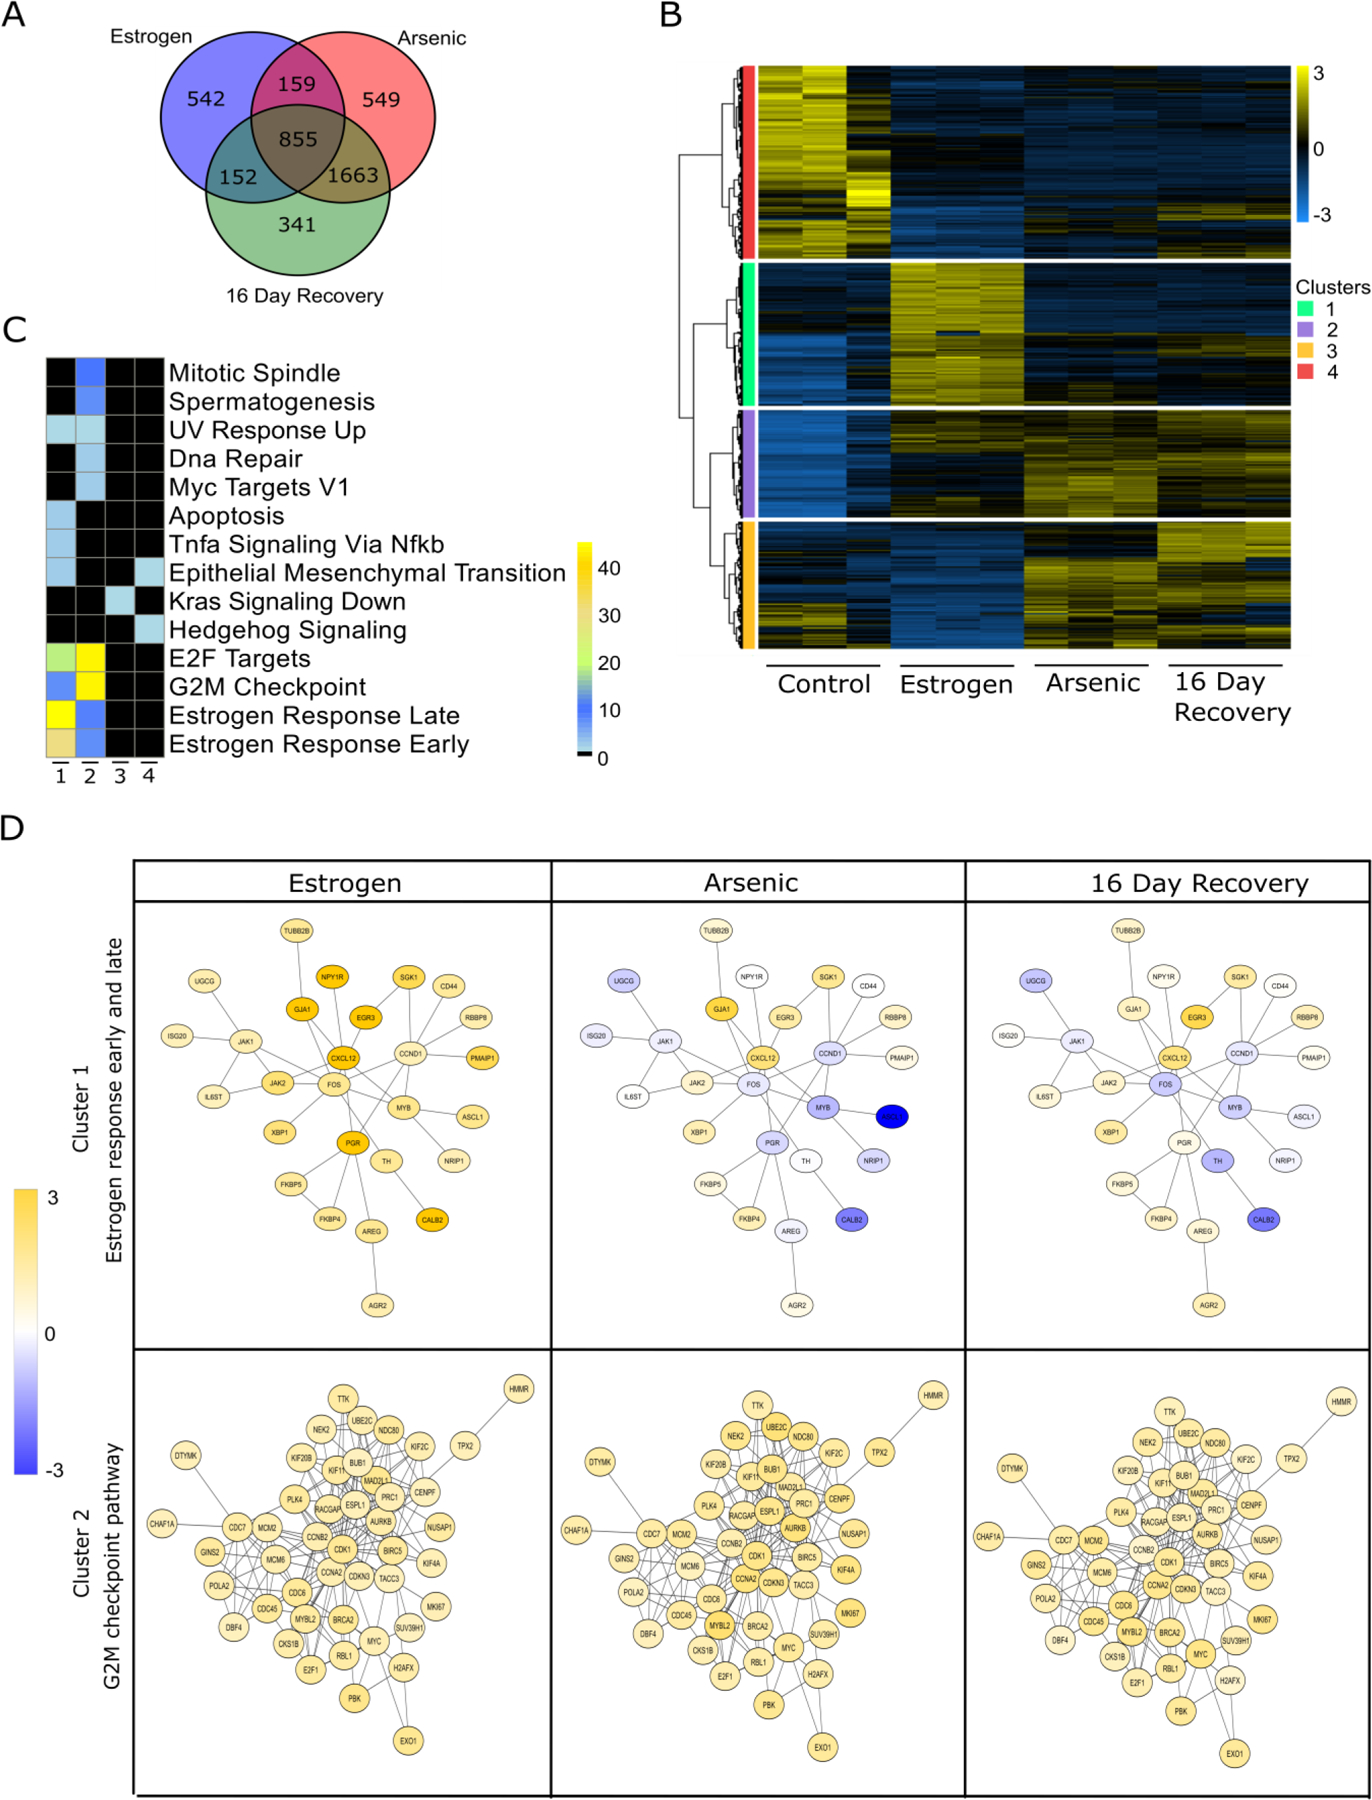
Figure 7. RNA-seq analysis of MCF-7 cells exposed to iAs followed by a recovery period.

(A) Venn diagram of differentially expressed genes (DEGs) in cells exposed to iAs (100 nM) for 300 days prior to and after a 16 days recovery period. Analysis were performed at baseline and after stimulation with E2. (B) RPKM expression levels of DEGs normalized to the Z scale and plotted for different conditions with respect to control. Hierarchical clustering was performed to obtain clusters of gene expression patterns. (C) DEGs from each cluster in (B) underwent pathway enrichment analysis with RITAN. Color scale represents log10 (FDR) for pathway significance with black indicating no significance. (D) Protein-protein interaction networks of specific pathways present in clusters 1 and 2. Gene fold changes with respect to controls are represented in yellow (upregulation), blue (downregulation) and white (no change).
