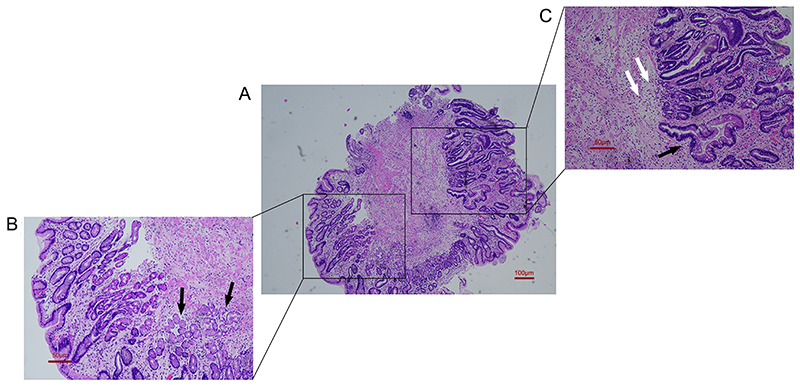
Figure 3. Pathological examination of a gastric antrum specimen in Case 1. A, Overall view (×40, scale bar 100 μm). B, Local view (×100, scale bar 50 μm) showing a small amount of normal antral glands (black arrows). C, Local view (×100, scale bar 50 μm) showing that the normal glands in the submucosal basal layer are completely atrophied (white arrows) and replaced with numerous intestinal goblet cells and metaplastic glands (black arrows).

