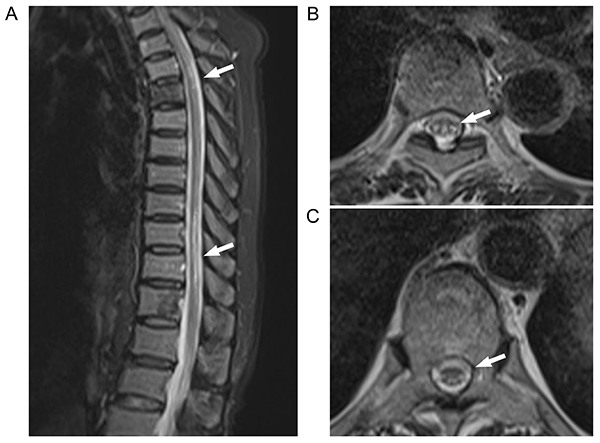
Figure 4. T2-weighted magnetic resonance images of thoracic vertebra in Case 2. A, Sagittal view shows high-signal intensity lesions in the thoracic spinal cord (arrows). B and C, Axial views show the spinal cord “small print” sign at different positions in the thoracic segment (B, T5 level; C, T10-T12 level; arrows).

