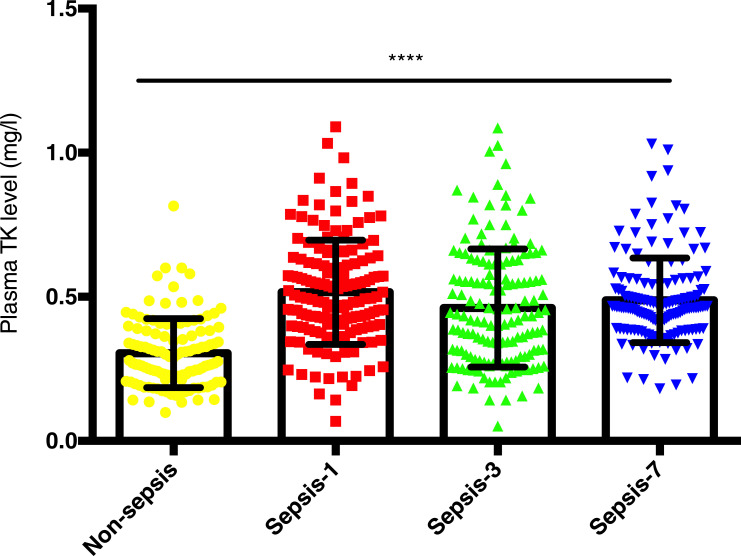
Figure 1.
The mean plasma tissue kallikrein (TK) levels in controls and septic patients. TK levels in controls (76 controls and 42 SIRS patients) and septic patients who were admitted to ICU (62 septic patients and 88 patients with septic shock) on the day of diagnosis (Day 1), 3 days after diagnosis (Day 3), and 7 days after diagnosis (Day 7) are displayed. Data were presented as mean ± standard deviation of the mean (SD). One-way analysis of variance was used to indicate statistical difference. ****P<0.0001.

