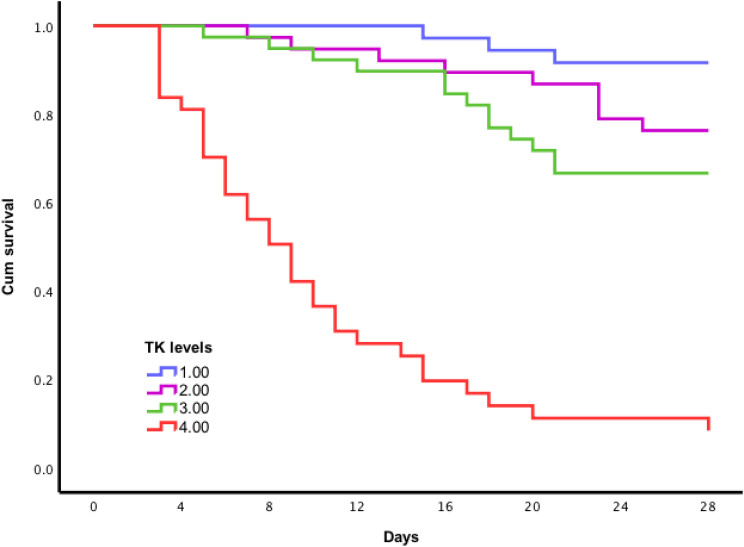
Figure 4.
Kaplan–Meier survival curves based on plasma tissue kallikrein (TK) level. 1 = quartile 1; 2 = quartile 2; 3 = quartile 3; 4 = quartile 4. Compared with Quartile 1, Quartile 2 (24%, 26 days vs 8%, 27 days, Log rank test, p =0.079); Quartile 3 (33%, 24 days vs 8%, 27 days, Log rank test, p=0.008), and Quartile 4 (89%, 11 days vs 8%, 27 days, logrank test, p < 0.001) had higher risk of death and shorter event-free survival time.

