
Fig. 3.
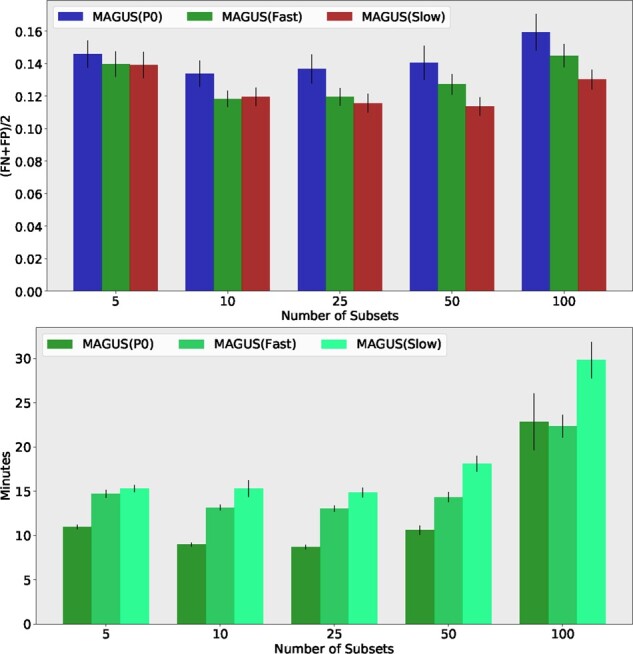
Experiment 1(b): Exploring the impact of starting tree, HMM-extension and subset number on MAGUS on 1000M1. Top: The error rates are the average of SPFN and SPFP, and are averaged over the 19 replicates of the 1000M1 model condition. Error bars indicate standard error. MAGUS(P0) uses the PASTA starting tree instead of the MAGUS starting tree. MAGUS(Slow) uses the HMM-extension. The x-axis shows the impact of changing the number of subsets. Bottom: Average running time (in minutes), averaged over the 19 replicates of the 1000M1 model condition. Error bars indicate standard error. The x-axis shows the impact of changing the number of subsets