. 2021 Jul 19;10:e66063. doi: 10.7554/eLife.66063

Figure 1. Two cell populations with skeletal stem cell characteristics in postnatal long bones.

(A) Diagram showing two previously described skeletal stem cell (SSC) populations and the downstream populations they generate, which were defined by the specific expression patterns of cell surface proteins. Top: SSC lineage tree of the osteochondral SSC (ocSSC) that gives rise to bone, cartilage, and stromal populations. Bottom: the lineage tree of the perivascular SSC (pvSSC) able to give rise to bone, cartilage, adipose tissue, and stromal populations. BCSP: bone cartilage stroma progenitor; CP: cartilage progenitor; APC: adipogenic progenitor cell; Pre-Ad.: pre-adipocyte; OPC: osteochondrogenic progenitor cell. (B) Representative flow cytometric gating strategy for the isolation of ocSSCs (top) and pvSSCs (bottom). (C) Representative confocal microscopy images of in vivo derived single-color clonal colonies of renal capsule-transplanted purified ocSSCs (left) and pvSSCs (right) derived from Actin-CreERt Rainbow mice. Three independent transplants per cell type under renal capsules were performed. (D) Renal capsule transplant-derived ossicles of purified GFP-labeled ocSSCs (top) and pvSSCs (bottom). Images show the photograph of the kidney with transplant (top left) and GFP signal of graft tissue (bottom left) as well as Movat pentachrome cross-section staining (right). (E) Quantification of ocSSC (top) and pvSSC (bottom) graft composition. Results of three separate experiments with n = 3 per SSC type. All data are shown as mean ± SEM. (F) Representative images of staining of clonally derived cultures that underwent tri-lineage differentiation assays in vitro. Alcian blue (chondrogenesis), Alizarin red S (osteogenesis), and oil red O (adipogenesis) stainings are shown along with the number of clones that stained positive for each differentiation type (ocSSC n = 7; pvSSC n = 8 clones). (G) Representative immunohistochemistry images for GFP (green) and perilipin (red) of tissue derived from intratibially transplanted purified GFP-labeled ocSSCs (top) and pvSSCs (bottom) 2 weeks after injection. White arrowheads: GFP+Perilipin+ cells. TB: trabecular bone. Three separate experiments with ocSSC n = 3 and pvSSC n = 4. Scale bars, 30 µm.

Figure 1.

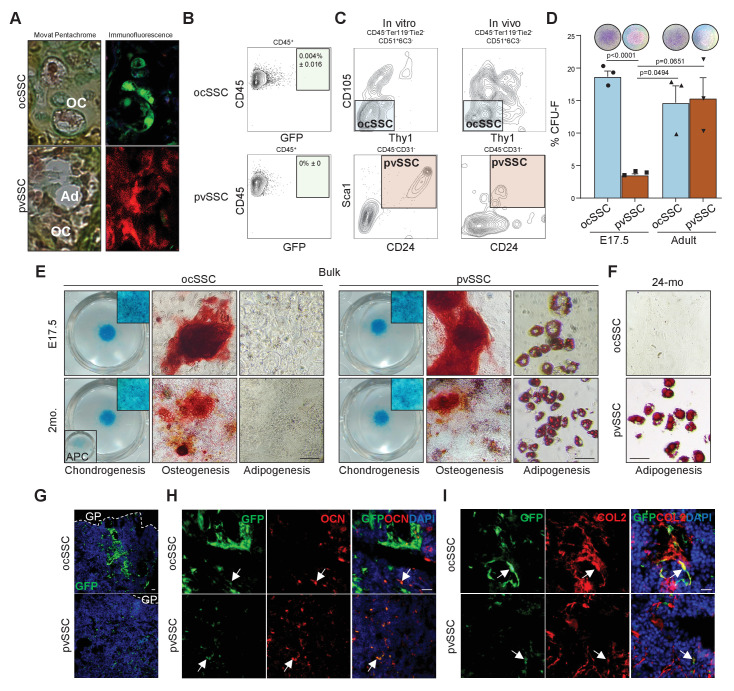
Figure 1—figure supplement 1. Perivascular SSCs, but not ocSSCs, are a source of bone marrow adipose tissue.

Figure 1—figure supplement 1.

(A) Clonally derived osteochondrogenic (OC) and adipogenic (Ad) cell types of transplanted purified osteochondrogenic skeletal stem cells (ocSSCs) (top) and perivascular SSCs (pvSSCs) (bottom) isolated from ‘Rainbow’ mice detected in derived renal grafts. Left, Movat pentachrome staining of graft tissue and right, adjacent section with immunofluorescence of a green and a red clone. (B) Flow cytometric profile of GFP-labeled ocSSC (top) or pvSSC (bottom)-derived graft tissue of renal transplants for expression of CD45 and GFP. (C) Representative flow cytometric profiles of in vitro (left) derived primary cultures of purified ocSSCs (top) and pvSSCs (bottom) as well as in vivo generated grafts (right). (D) Fibroblast colony-forming unit (CFU-F) assay results of purified ocSSCs and pvSSCs from long bones of E17.5 embryos and 8-week-old mice (n = 3 per age group). Representative colonies derived from ocSSCs and pvSSCs stained for crystal violet are shown above respective data columns. (E) Tri-lineage differentiation outcome of bulk-sorted ocSSCs (left) and pvSSCs (right) from E17.5- or 8-week-old-mouse-derived long bones. Alcian blue (chondrogenesis), Alizarin red S (osteogenesis), and oil red O (adipogenesis) stainings are shown. APCs (adipogenic progenitor cells) that underwent chondrogenesis are shown as control. (F) Oil red O stainings of ocSSC and pvSSC derived from long bones of 24-month-old mice (24-mo) that underwent adipogenic differentiation are shown. (G) Immunohistochemistry fluorescence image of GFP-labeled ocSSC (top)- and pvSSC (bottom)-derived cells 2 weeks after intratibial injection. GP = growth plate. (H) Co-staining of ocSSC (top)- and pvSSC (bottom)-derived cells (green) with the osteogenic label osteocalcin (OCN) and (I) the chondrogenic label COL2. Scale bars, 30 µm. All data are shown as mean + SEM. Significance between groups assessed by unpaired, two-tailed Student’s t-test and corrected with Welch’s test for unequal distribution if needed.
Figure 1—figure supplement 1—source data 1. Functional characterization of ocSSCs and pvSSCs.