. 2021 Jul 19;10:e68549. doi: 10.7554/eLife.68549

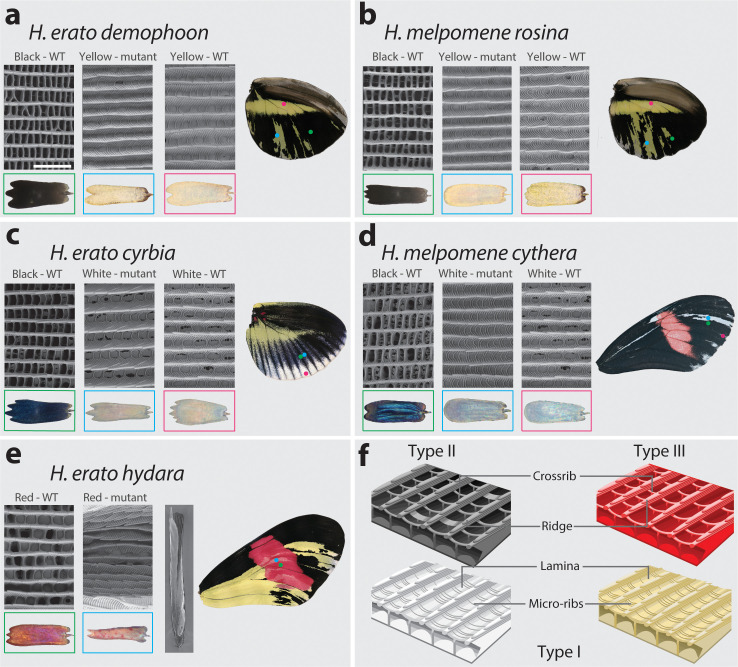
Figure 9. SEM reveals structural changes induced by cortex KO.

Ultrastructural morphology of H. erato demophoon (a) and H. melpomene rosina (b) hindwing scales for wild-type (WT) black, mutant yellow and wild-type yellow scales. Light micrographs of each scale are shown below the representative SEM images. Scale morphologies are also presented for morphs displaying shifts to white scales in H. erato cyrbia (c) and H. melpomene cythera (d). Structural changes in the red scales of H. erato hydara (e) are accompanied by scale deformations, resulting in a curled appearance. Cartoon depiction of scale ultrastructure illustrating differences between scale types (f). Type I scales are characterised by the presence of a lamina covering the scale windows and by microribs joining the longitudinal ridges. Type II scale cells display larger crossribs and lack a lamina covering the scale windows. Type III scale cells and are characterised by larger spacing between crossribs and ridges. Scale bar in (a) = 3 µm.

Figure 9—source data 1. Pairwise Wilcox test adjusted p-values for quantitative measures of scale structures and features in H.melpomene.
Figure 9—source data 2. Pairwise Wilcox test adjusted p-values for quantitative measures of scale structures and features in H.erato.

Figure 9.

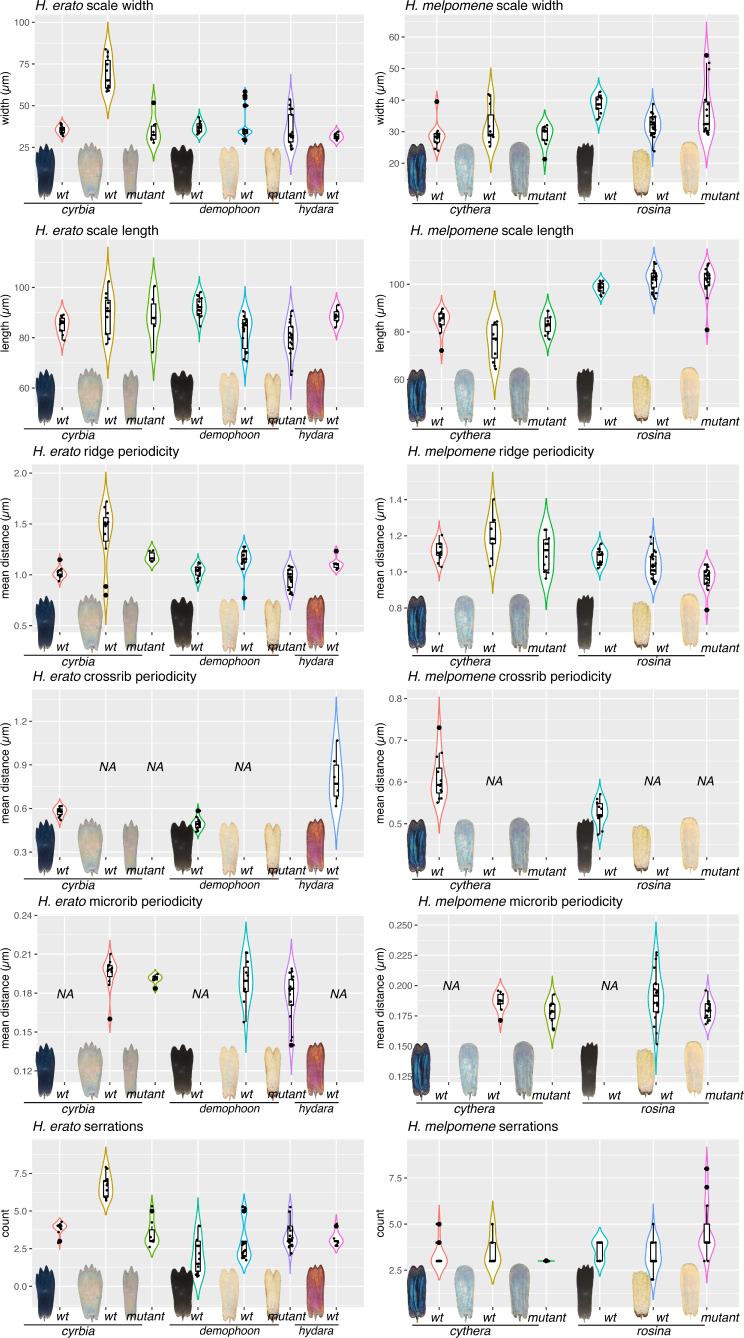
Figure 9—figure supplement 1. Quantitative measures of scale structures and features.

Figure 9—figure supplement 1.

For each scale type depicted in Figure 9, between 8 and 15 scales were removed from the wing with an eyelash tool and imaged on SEM at 3000×. (Raw EM stitches can be found at the Dryad entry for this manuscript.) Each measurement was taken as previously described by Day et al., 2019. Briefly, a line segment was drawn over the scale in FIJI, and pixel intensity levels extracted. The resulting curves were subject to Fourier analysis to get mean measures for Ridge periodicity, crossrib periodicity and microrib periodicity. Serrations were counted manually.
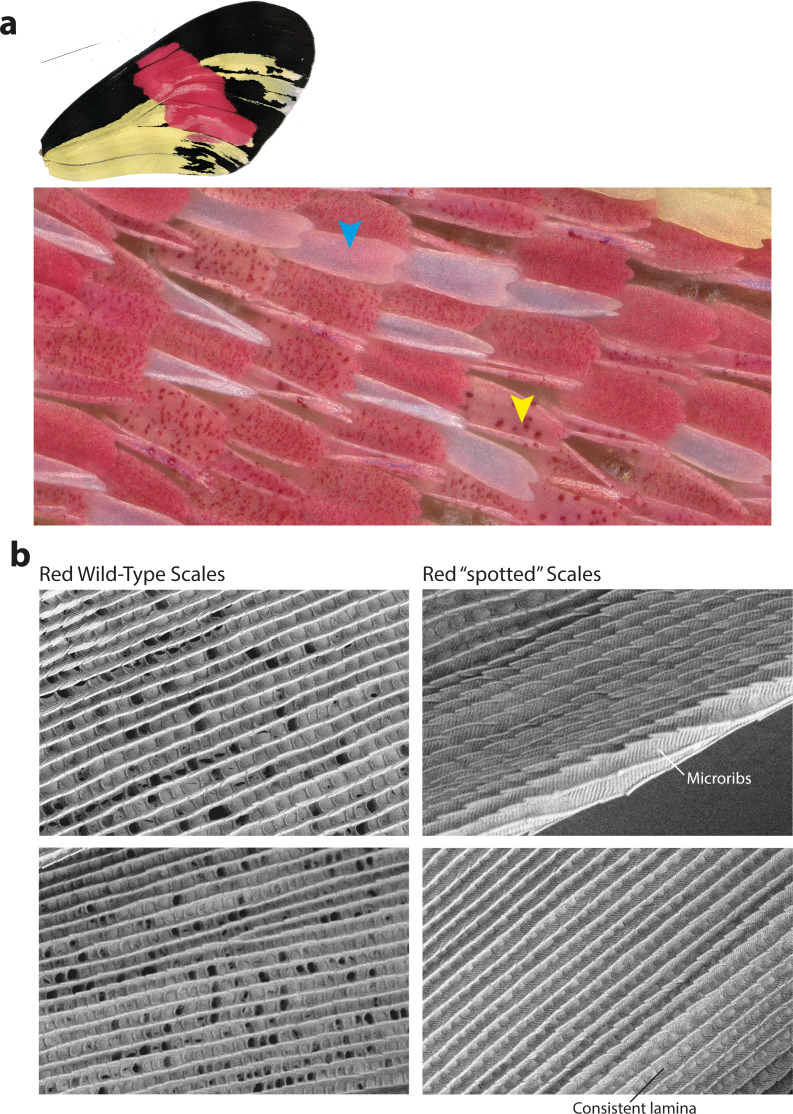
Figure 9—figure supplement 2. Cortex KOs in red scales produce aberrant morphologies with features consistent with Type I scale transformations.

Figure 9—figure supplement 2.

(a) Cortex perturbations result in both fully white scales across the red band (blue arrowhead) as well as a ‘spotted’ phenotype, where the pigment appears to be asymmetrically deposited across the scale (yellow arrowhead). Many of the mutant scales also take up an aberrant morphology and appear curled in shape. (b) SEM images reveal that the mutated scales have features consistent with Type-I-like morphology, including the presence of microribs and consistent lamina covering the scale windows.