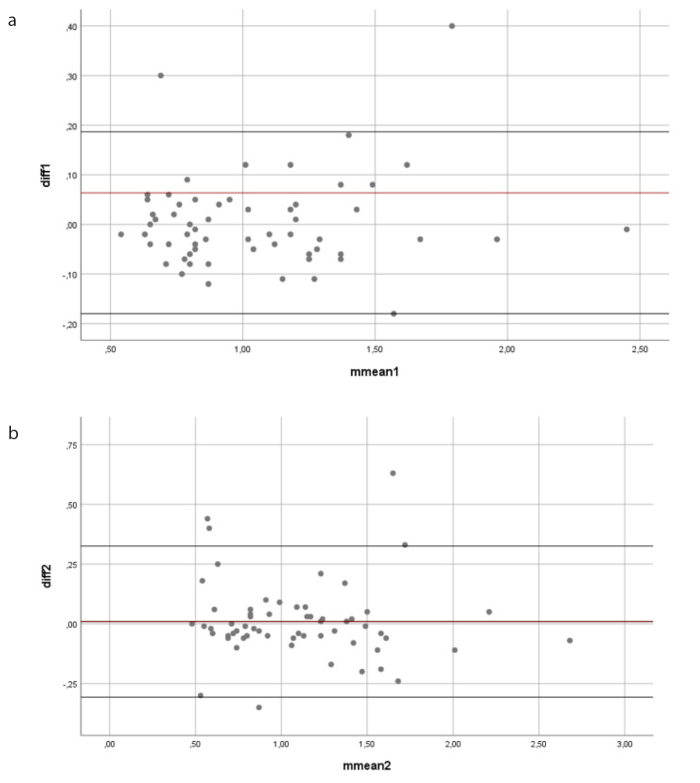
Figure 4. a, b.
Visual inspection of Bland–Altman plot. Chart (a) shows the ADC measurements of Reader 1 and Reader 2. The longitudinal axis shows the differences in the measurements of the readers, and the horizontal axis shows the means of the measurements of the readers. Chart (b) shows the ADC measurements of rt-DWI of Reader 1 and Reader 2. The longitudinal axis shows the differences in the measurements of the readers, and the horizontal axis shows the means of the measurements of the readers.

