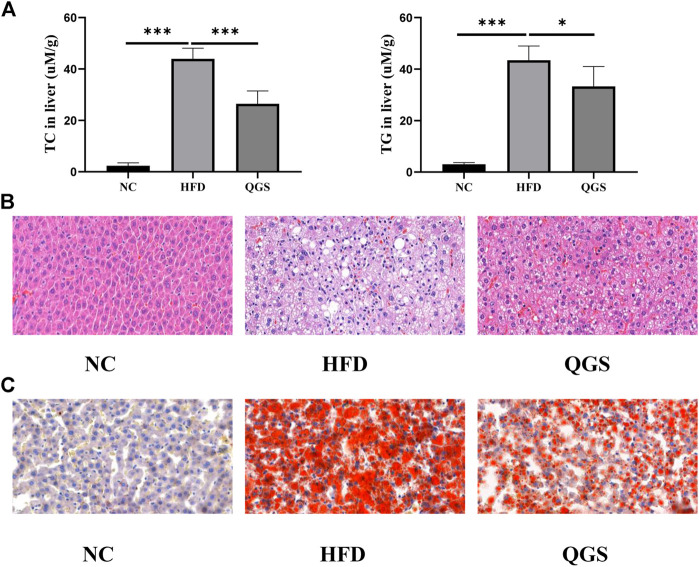
FIGURE 3.
Levels of lipid accumulation in the liver. (A) Levels of TC and TG in the liver. (B) Hematoxylin and eosin staining of liver tissue at ×40.0 magnification. (C) Oil red O staining of liver tissue at ×40.0 magnification. The data are presented as means ± SEM. ns, no significant difference. *p < 0.05, **p < 0.01, ***p < 0.001, vs. the HFD group.

