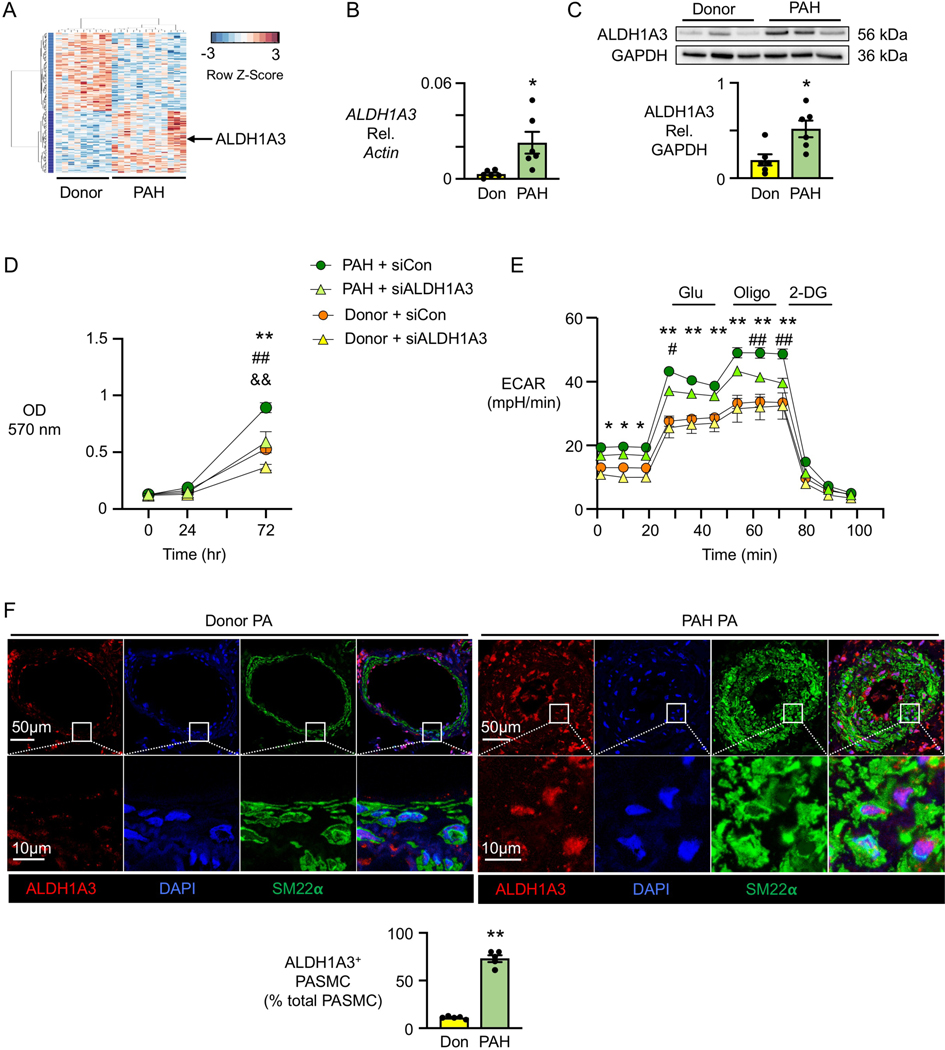
Figure 1. ALDH1A3 is induced in PAH PASMC.
(A) Heatmap of gene expression in PASMC from nine Donor controls vs. 12 PAH patients.
(B) ALDH1A3 mRNA expression in six donor controls (Don) and six PAH patients by qPCR under 48h serum starvation (0.2% FBS) followed by 72h serum stimulation (5% FBS).
(C) Representative immunoblot of ALDH1A3 protein expression relative to GAPDH in three donor controls and three PAH patients, with quantification, in PASMC from six donor controls and six PAH patients under the conditions of B. In (B, C), n=6. *p<0.05 by unpaired Student t test and Welch t-test in B since the variance was unequal.
(D) MTT assay (OD 570 nm) as a measure of cell proliferation using PASMC from three donor controls and three PAH patients transfected with non-targeting control (Con) siRNA or ALDH1A3 siRNA. Values are given after 48h of serum starvation (0 hour) followed by serum stimulation at 24, 48 and 72 hours.
(E) Extracellular acidification rate (ECAR) in response to glucose (Glu), oligomycin (Oligo), and 2-deoxyglucose (2DG). The measurements were normalized to cell numbers. In (D, E), n=3. *p<0.05, **p<0.01, Donor siCon vs PAH siCon; #p<0.05, ##p<0.01 PAH siCon vs PAH siALDH1A3, &&p<0.01 Donor siCon vs siALDH1A3, at the indicated time point, by repeated measures two-way ANOVA followed by Bonferroni analysis.
(F) Representative immunofluorescent staining of ALDH1A3 and SM22⍺ in pulmonary arteries of five donor controls and five PAH patients. Quantification of percent fluorescence of ALDH1A3 in five donor and five PAH lung tissues, three PA in each sample averaged. n=5. **p<0.01 by unpaired Student t test.

