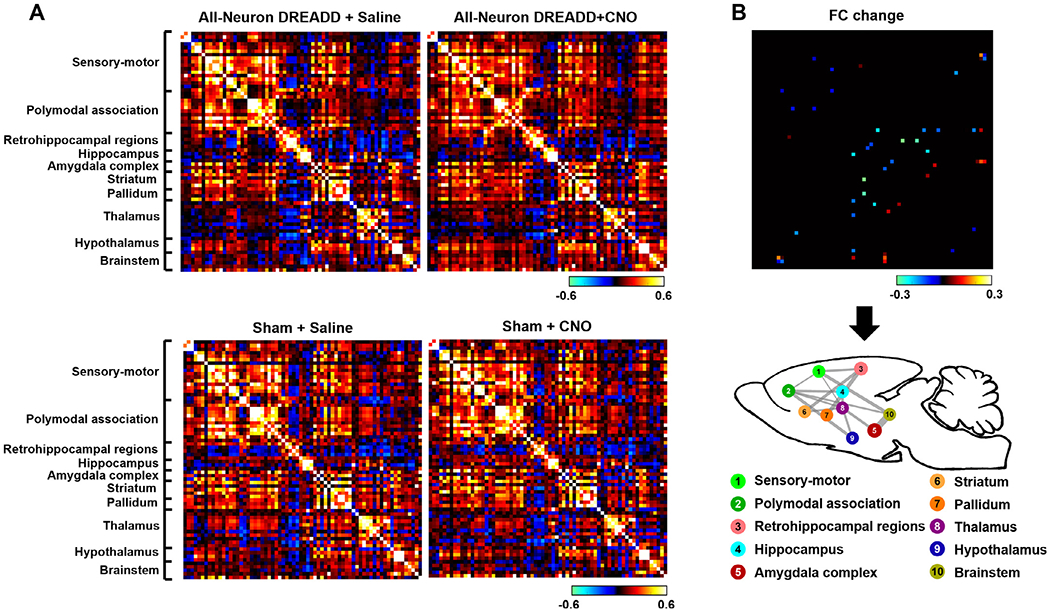
Fig. 3. Suppressing the dACC changes RSFC in connections widespread the whole brain.

A) Top: averaged ROI-wise RSFC matrices after saline and CNO injections in the all-neuron DREADD group, respectively. Bottom: averaged ROI-wise RSFC matrices after saline and CNO injections in the sham group, respectively. B) Top: connections exhibiting significant RSFC changes after saline and CNO injections (two-way ANOVA, linear mixed model, pinteraction < 0.05, FDR corrected). RSFC changes between the CNO and saline conditions in the DREADD group were color coded with cold colors representing reduced RSFC and hot colors representing increased RSFC. Bottom: Connections with significant functional connectivity changes were grouped into multiple brain systems. Line thickness represents the total number of connections with significant RSFC changes between the two systems.
