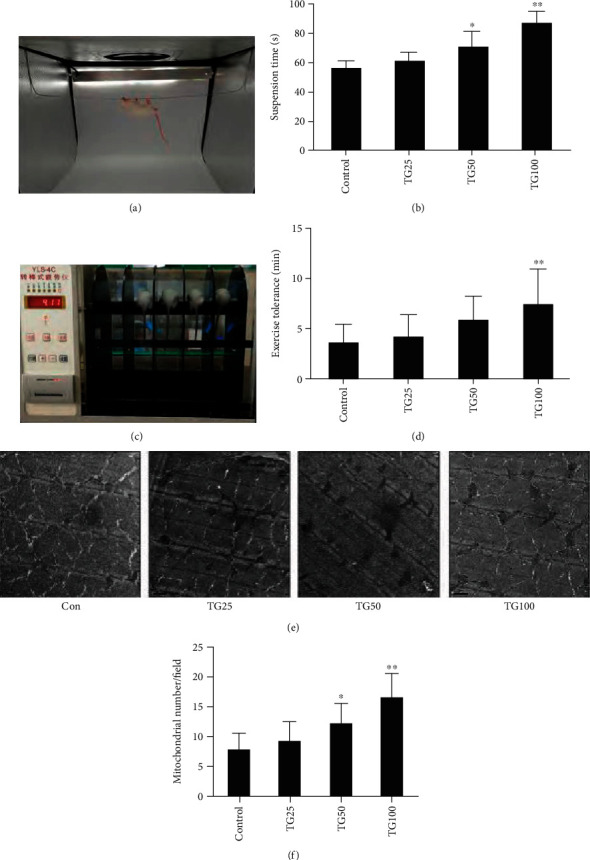
Figure 4.

Improvement of exercise performance and skeletal muscle mitochondrial biogenesis of mice using tangeretin. Hanging wire test (a, b), exercise tolerance test (c, d), transmission electron microscope micrographs (e), and mitochondrial numbers (f). Con (control), TG25 (25 mg/kg tangeretin group), TG50 (50 mg/kg tangeretin group), and TG100 (100 mg/kg tangeretin group) (mean ± SD), ∗p < 0.05, ∗∗p < 0.01 in comparison with the control group. Scale bars = 1 μm. Reprinted (adapted) with permission from [112]. Copyright (2018) American Chemical Society.
