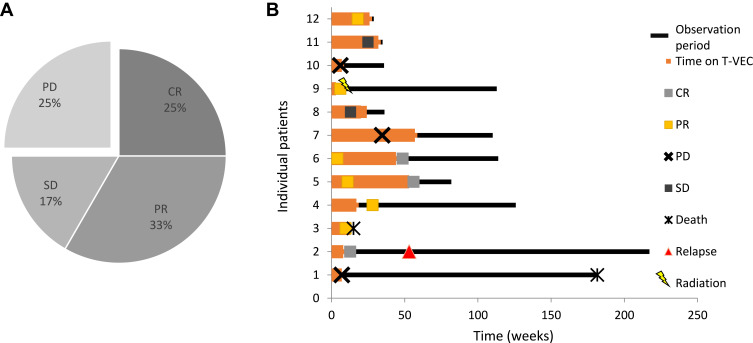
Figure 1.
Treatment evaluation. (A) Response to T-VEC therapy. Complete responses were observed in three of twelve patients, partial responses in four of twelve patients and stable disease was seen in two patients. Overall response rate was 58.3% (7/12 patients), and disease control rate was 75.0% (9/12 patients). (B) Individual therapy courses. Each lane of the swimmer plot represents the therapy course of one individual in this study over time. The red bars show the time on treatment; black bars represent the follow-up time. Events of response [complete response (CR): green box, partial response (PR): yellow box, stable disease (SD): grey box; progressive disease (PD): black cross], relapse (red triangle) and death (asterisk) are marked.

