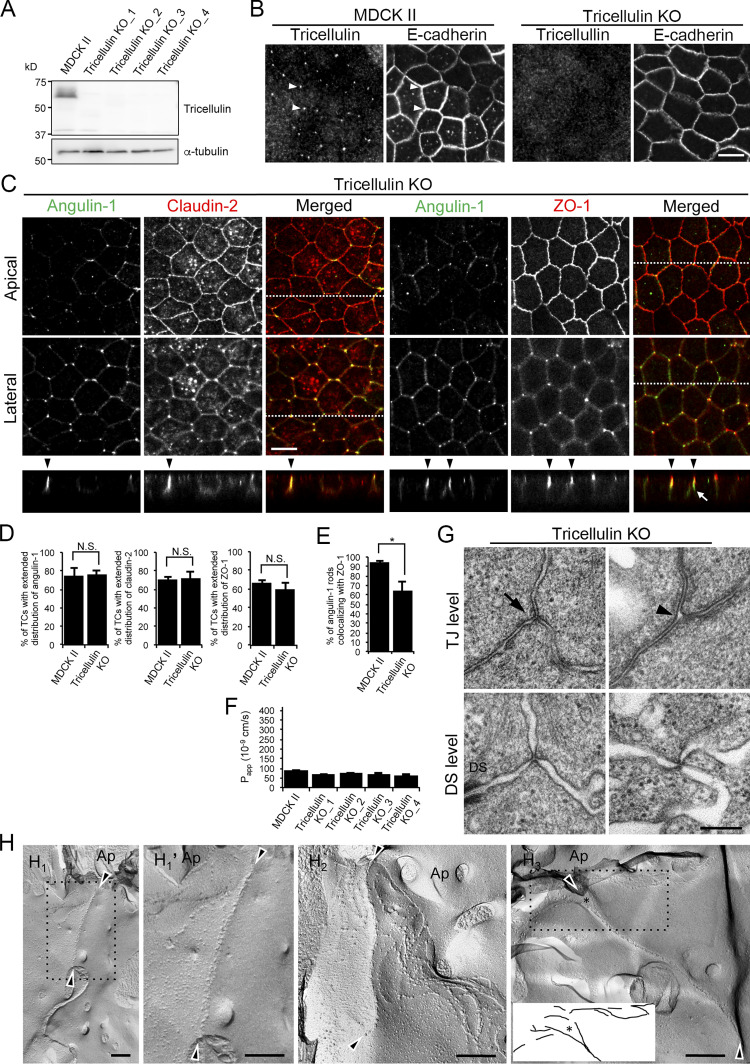
Figure 9.
Roles of tricellulin in tTJ formation and epithelial barrier function. (A) Lysates of four independent tricellulin-KO cell clones (tricellulin–KO_1–4) were analyzed by Western blotting with anti-tricellulin pAb or anti–α-tubulin mAb. (B) Tricellulin–KO_4 cells were immunostained with anti-tricellulin pAb and anti–E-cadherin mAb. Arrowheads indicate TCs. (C) Double-immunofluorescence staining of tricellulin–KO_4 cells with anti–angulin-1 pAb and anti–claudin-2 mAb or anti–angulin-1 pAb and anti–ZO-1 mAb. Arrowheads indicate TCs. Confocal sections of the apical region, including TJ markers and the lateral region, together with the corresponding Z-stack images along the white dotted lines are shown. The white arrow indicates an angulin-1–positive region at a TC without ZO-1. (D) Quantification of TCs with extended distribution of fluorescence signals of angulin-1, claudin-2, and ZO-1 to the basal direction. The data in MDCK II cells in the middle and right graphs are identical to those in Fig. 4 D. (E) Quantification of angulin-1 rods colocalizing with ZO-1 at TCs. (F) Paracellular flux of fluorescein in MDCK II and tricellulin–KO_1–4 cells. Data are shown as mean ± SD (n = 3). Papp, apparent permeability. (G) EM observation of horizontal ultrathin sections of tricellulin–KO_4 cells. TCs at the level of TJs (TJ level) and the more basal level of the lateral membrane containing desmosomes (DS level) were analyzed. The TJ level contained either the plasma membrane contact (arrow) or a gap (arrowhead) at TCs. The number of closed TCs/open TCs analyzed at the TJ level was 2/4 (n = 6). Close plasma membrane contacts at TCs were also observed at the DS level. (H) Freeze-fracture EM observation of tricellulin–KO_4 cells. Arrowheads indicate the central sealing elements without connection of short TJ strands (H1, H1', H2, and H3). In H3, visible TJ strands in the dotted box are traced. The asterisk indicates a cave-in of vertical TJ strands. Ap, apical side. (D and E) Data are shown as mean ± SD (n = 3) and were analyzed by Student’s t test. *, P < 0.01. Bars: 10 µm (B and C) and 200 nm (E and F).

