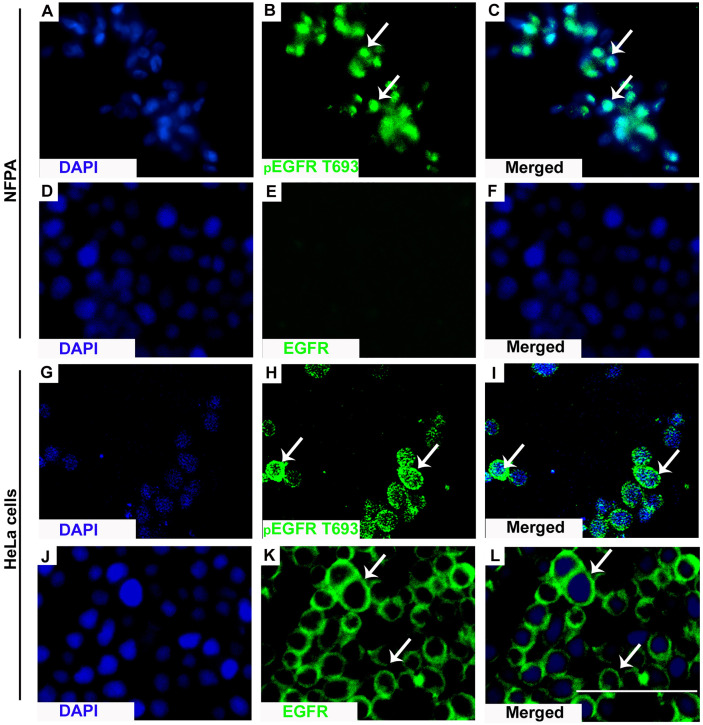
Figure 2.
Nuclear localization of pEGFR T693. IF showed nuclear localization of pEGFR T693 in NFPAs (A–C) and HeLa cells as the positive control (G–I). In HeLa cells, EGFR showed membranous positivity (J–L) while no EGFR expression was observed in NFPAs (D–F). EGFR and pEGFR T693 are shown by green while the nucleus is represented as counterstaining by DAPI (blue). Magnification 400x.

