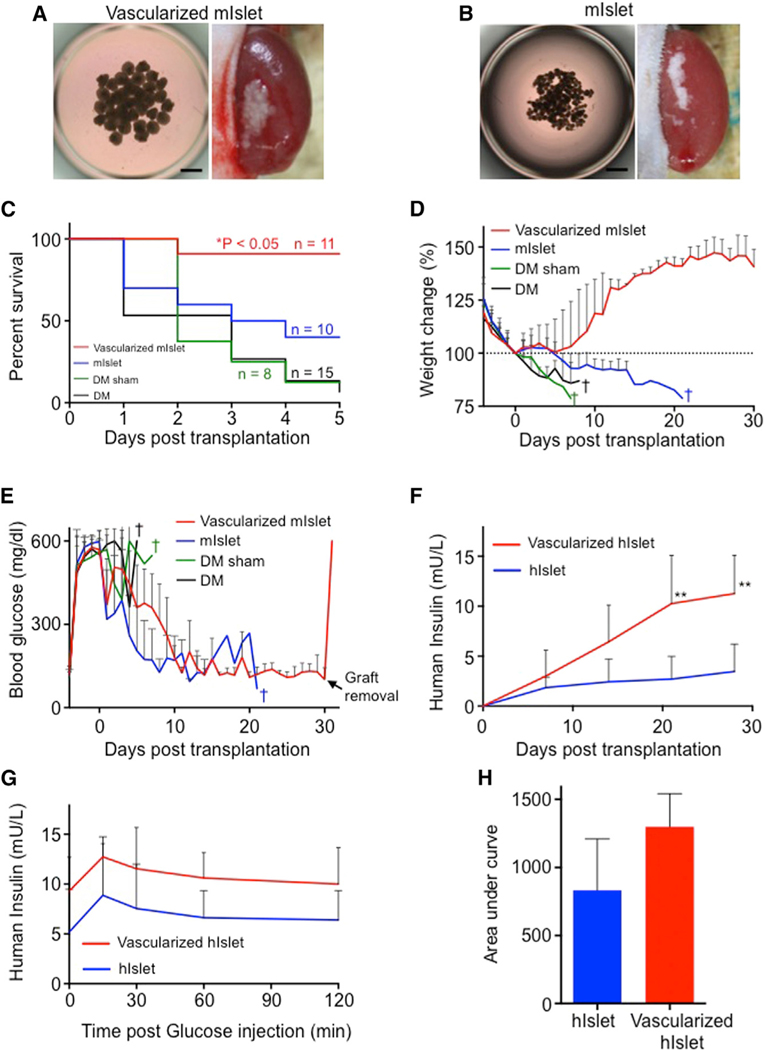
Figure 2. Vascularized Islet Self-Condensation Enables Efficient Therapeutic Transplantation.
(A and B) Brightfield image of the collected vascularized mouse islet (A), islet alone (B), and recipient kidneys after transplantation. Scale bars, 500 μm.
(C) Kaplan-Meier survival curves of the diabetic mice. *p < 0.05.
(D) Percentage of body weight variations in the diabetic mice. The data represent the mean ± SD. n = 11 vascularized mouse islet, n = 10 mouse islet alone, n = 8 diabetes mellitus (DM) sham mice, and n = 15 DM mice.
(E) Blood glucose measurements of the progressively diabetic mice. The glucose measurements were saturated at 600 mg/dL. The data represent the mean ± SD. n = 11 vascularized mouse islet, n = 10 islet alone, n = 8 DM sham mice, and n = 15 DM mice.
(F) In vivo human insulin secretion. The data represent the mean ± SD. n = 5 vascularized human islet and n = 8 human islet alone. **p < 0.01; *p < 0.05.
(G) Glucose tolerance testing 35 days after transplantation. The data represent the mean ± SD. n = 4 vascularized human islet and n = 4 human islet alone.
(H) Area under the curve for (G). The data represent the mean ± SD. n = 4 vascularized human islet and n = 4 human islet alone.

