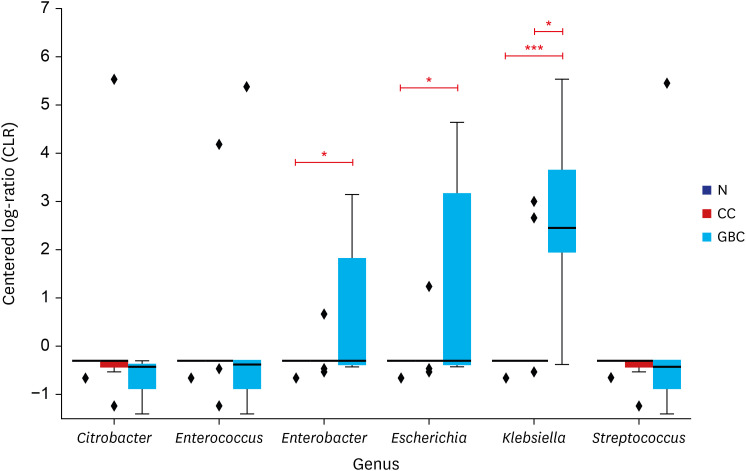
Fig. 4. The distribution of the six major bacteria in three different clinical groups.
Genera that show significant difference between two different groups are marked with asterisk: *P < 0.05, **P < 0.01, ***P < 0.001. Normalized values lower than −0.3072 are all derived from pseudo-count.
N = normal control, CC = chronic cholecystitis, GBC = gallbladder cancer.

