
Figure 1.
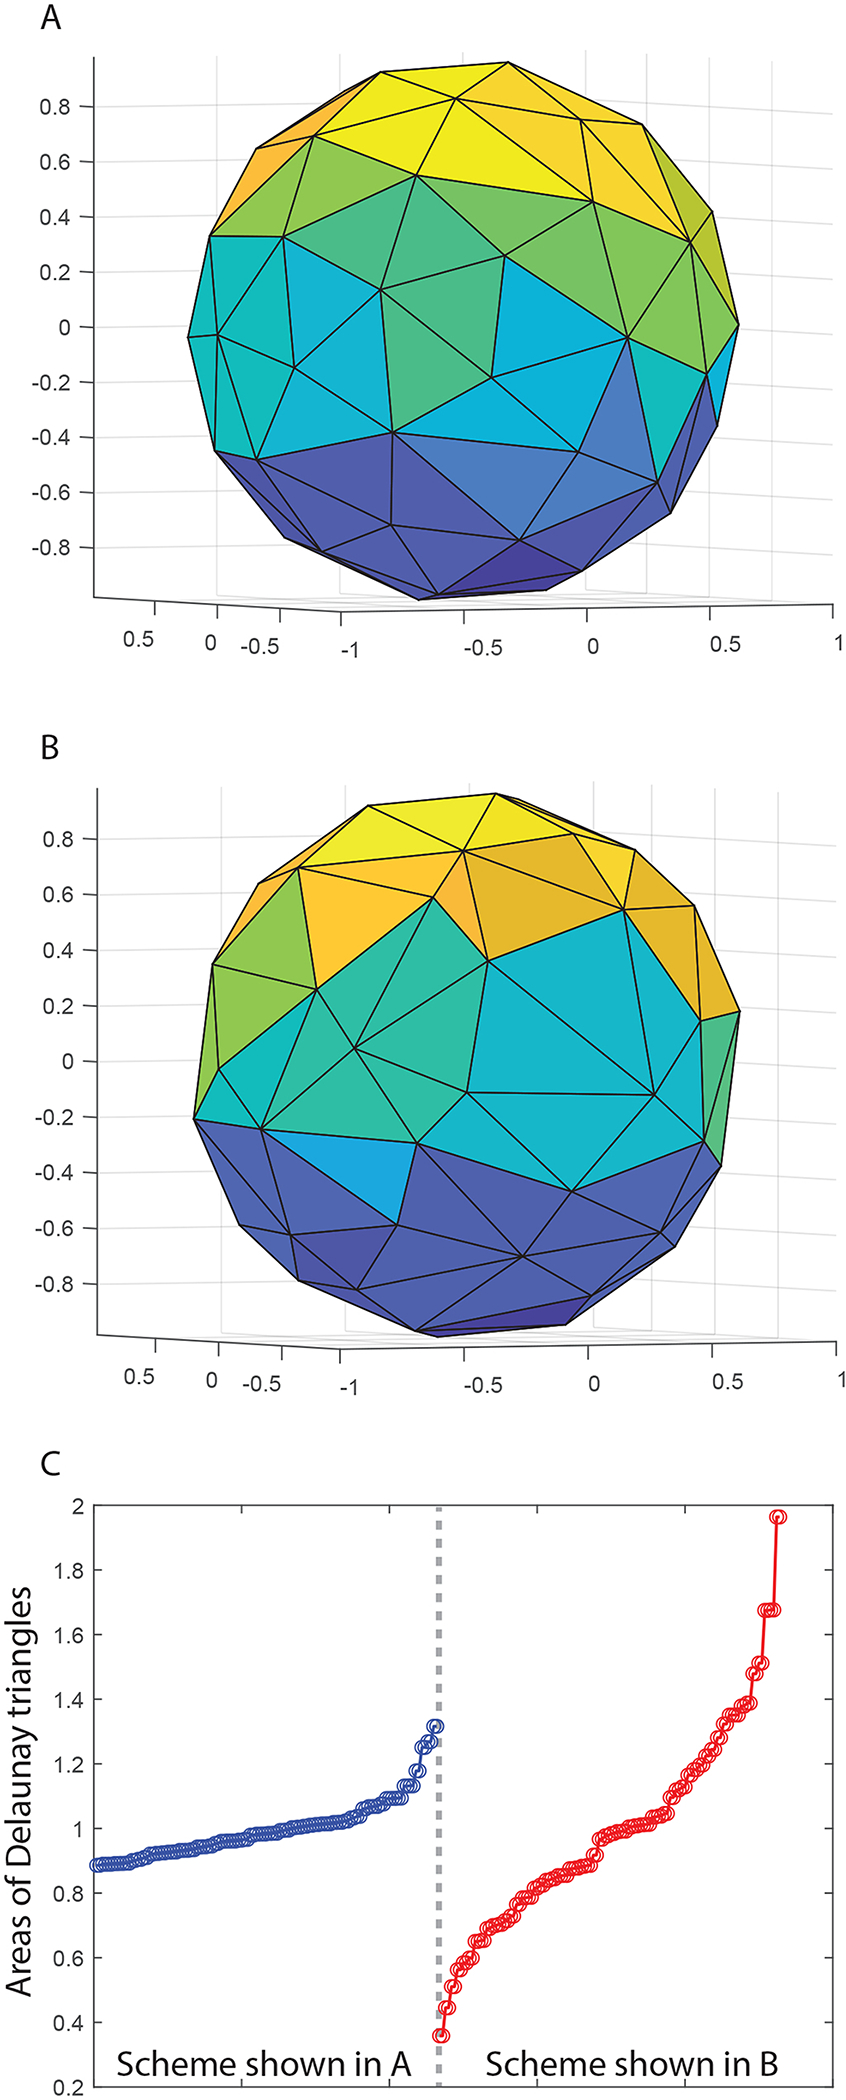
Figure 1A shows the Delaunay triangulation representation of 30 gradient directions that are uniformly distributed in space. Figure 1B shows the Delaunay triangulation representation of 30 gradient directions that are down-sampled from a protocol with 64 gradient directions (using the inner product approach described in the section 2.1). The areas of triangles shown in Figures 1A and B are plotted in the left and right panels of Figure 1C, respectively, in ascending order.