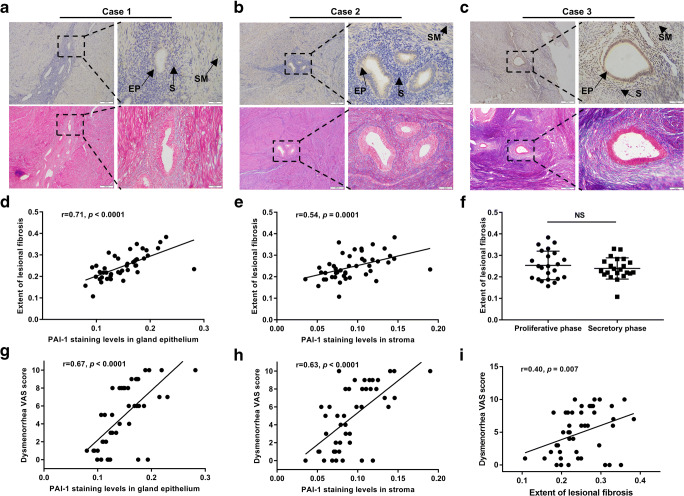
Fig. 2.
Associations among lesional PAI-1 immunoreactivity, the severity of dysmenorrhea, and the extent of fibrosis. a–c Masson’s trichrome-stained fibrosis and corresponding PAI-1 immunoreactivity in the biopsy samples derived from three representative cases. Black arrows indicate the localization of the glandular epithelium (GE), stroma (S), and smooth muscle (SM). Correlation of PAI-1 expression levels with the extent of lesional fibrosis in the glandular epithelium (d) and stroma (e); extent of lesional fibrosis between the proliferative phase and secretory phase (f); correlation between PAI-1 expression levels and the severity of dysmenorrhea, as measured by the VAS scores, in the glandular epithelium (g) and stroma (h); correlation of the extent of lesional fibrosis with dysmenorrhea VAS scores (i); the dashed line indicates a linear regression fit of the data. NS, P>0.05. MOD, mean optical density; GE, glandular epithelium; S, stroma; SM, smooth muscle

