Fig. 1.
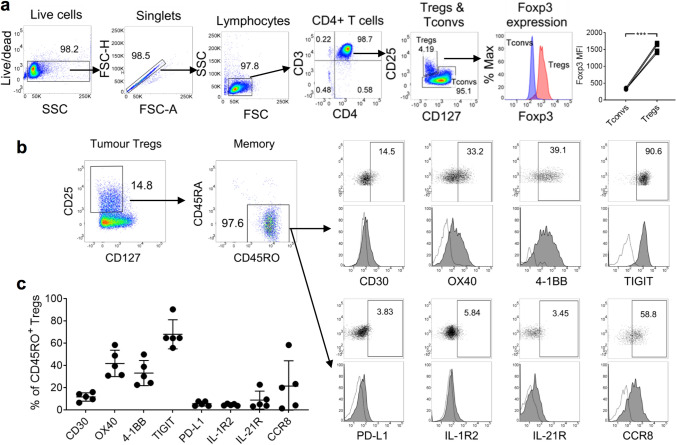
Tumor-infiltrating Tregs in CRC were predominantly CD45RO+ and expressed co-stimulatory molecules and cytokine receptors at varying levels. a Gating strategy for the analysis of Tregs by FCM. Data from four healthy subjects are presented as an example. CD4+ T cells were negatively selected from PBMCs using magnetic beads. Tregs were defined as CD4+CD25+CD127– cells; Foxp3 expression was significantly higher than Tconvs. MFI: geometric mean fluorescence intensity. Statistical analysis was performed using the two-tailed paired t test. *** denotes P < 0.001. b Phenotype of tumor-infiltrating Tregs. Tumor specimens from five CRC patients were dissociated into single-cell suspensions for analysis. Representative plots are shown. Numbers within plots represent percentages. Gates for dot plots were drawn based on isotype control antibodies. Dotted histogram: isotype control antibody; filled histogram: antigen-specific antibody. c Proportions of CD45RO+ tumor-infiltrating Tregs expressing individual protein markers

