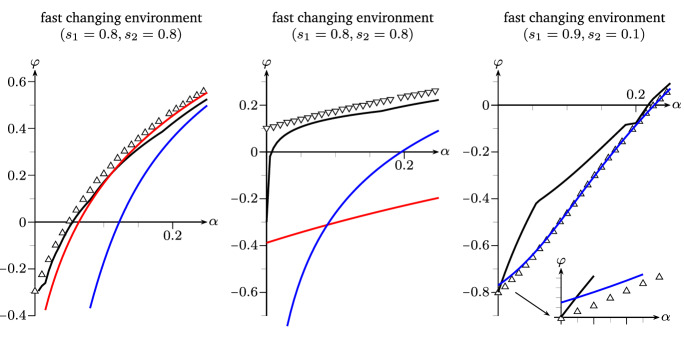
Fig. 9.
Left and mid: Comparison of lower bounds of - and -strategy resp. in setting of Fig. 7 (right)—red: Theorem 2.15, black: Corollary 3.8 maximized over 1000 random choices of the -parameters, blue: (Hautphenne and Latouche 2016, Theorem 3), and : approximation via simulation. On the right: Comparison of upper bounds—black: improved norm bound from Remark 3.7 with respect to , blue: (Hautphenne and Latouche 2016, Theorem 2), : approximation via simulation (color figure online)

